
"*" indicates required fields
"*" indicates required fields
"*" indicates required fields


Volatility hit the freight market in late September and early October due to the East and Gulf Coast port strikes and consecutive destructive hurricanes. However, the impact of these events was regionalized, and conditions normalized quickly as capacity easily absorbed the additional volume. Otherwise, demand remains stable, and capacity is abundant. As a result, the market continues to fluctuate in line with seasonal expectations, and major market movement is unlikely until mid-2025.
Port Strike: The East and Gulf Coast port strike is on hold. Both sides have returned to the negotiation table, and ports are again fully operational. The short-lived strike did not create any major disruptions. However, whether the two sides will reach a long-term agreement by January remains uncertain. As a result, shippers continue to make contingency plans like shifting operations to West Coast ports, which could strain infrastructure in the region until stakeholders reach an agreement.
Hurricane Helene: Hurricane Helene caused considerable damage, particularly in North Carolina, leading to long-term road closures that have disrupted regional routing and operations. Despite heavy damage, the storm’s short-term impact on the freight market appears to be limited and regional. However, recovery efforts may take several months and could drive future freight demand.
Hurricane Milton: Florida continues to navigate the fallout of Hurricane Milton. Regional inbound and outbound freight markets experienced significant disruption immediately following the storm but are normalizing as power is restored and repairs are made. The storm also did not meaningfully impact the long-term outlook for the national freight market.
"*" indicates required fields
Spot postings declined on a seasonal and annual basis in September.
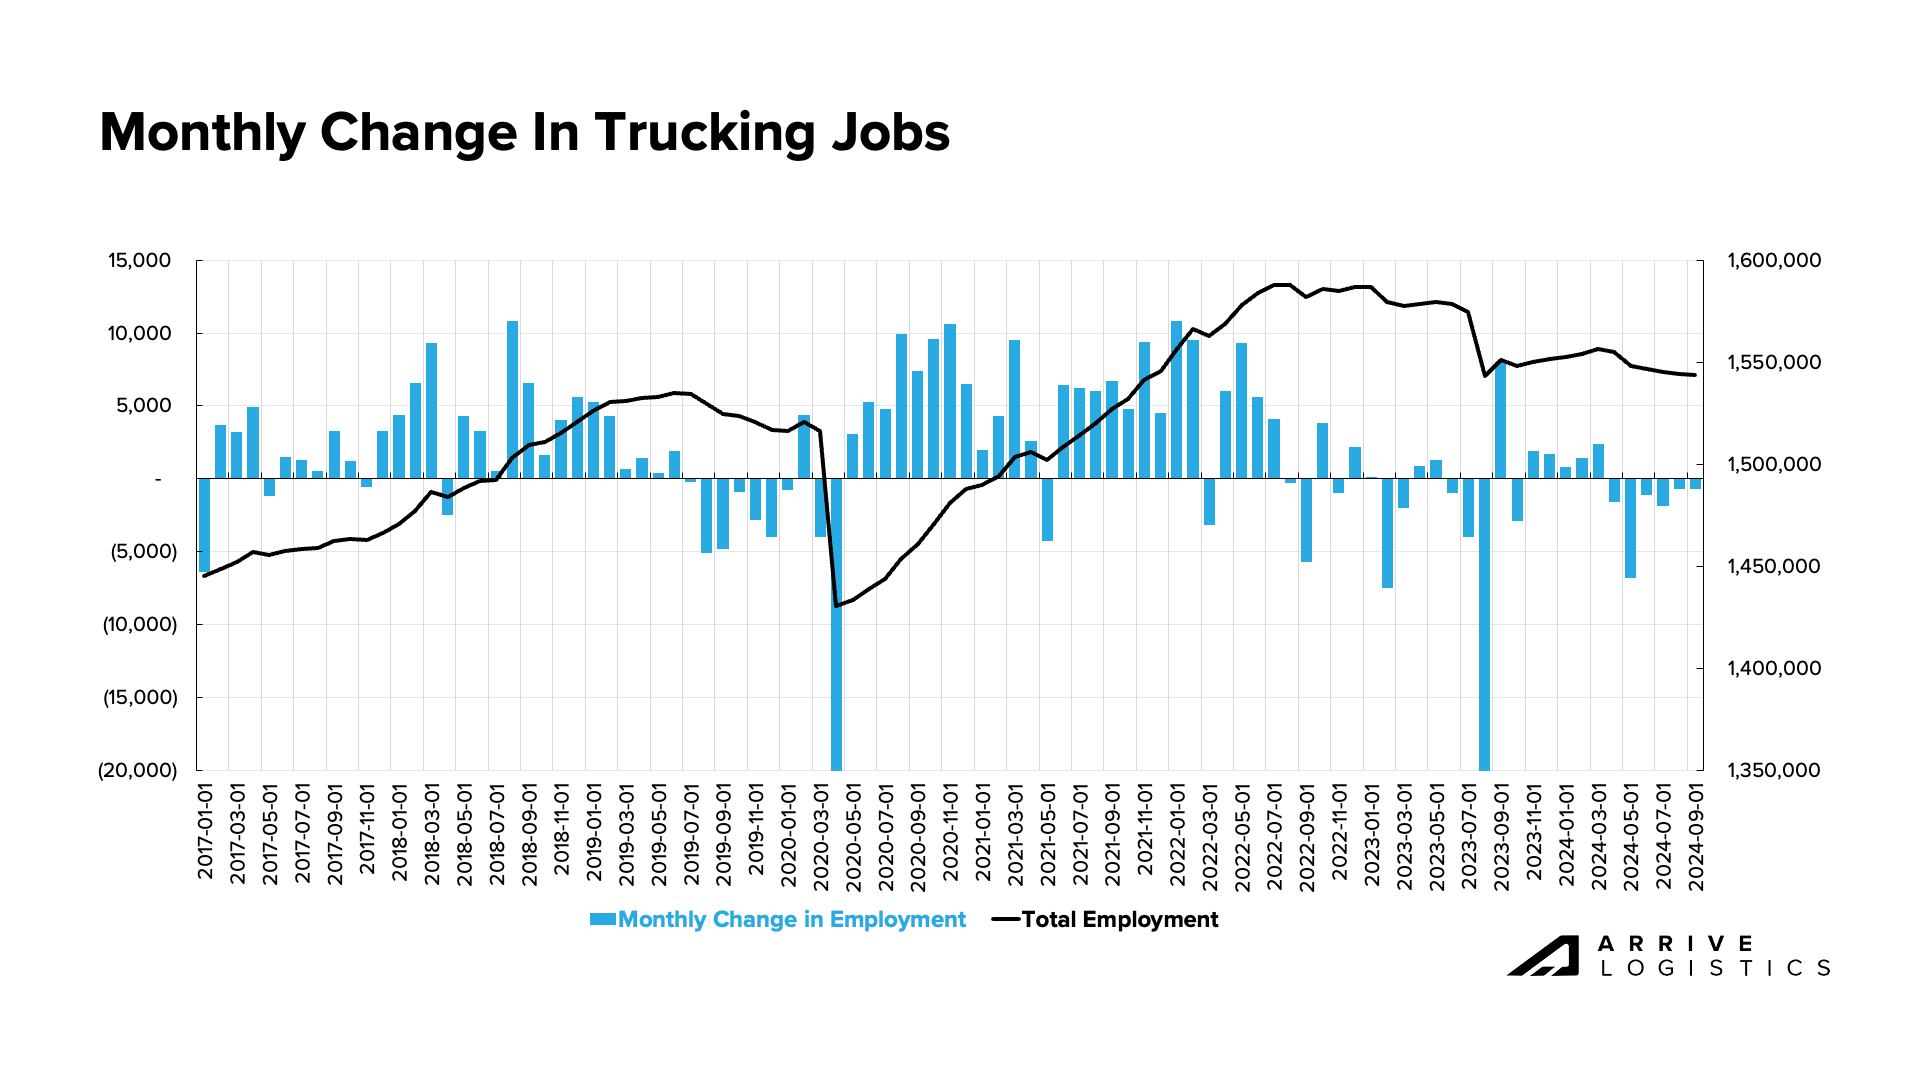
Trucking employment numbers declined again, indicating ongoing capacity attrition due to poor market conditions. However, overall levels remain elevated.
Tender rejections increased due to recent disruption, but rates remain relatively stable, indicating that capacity is sufficient to absorb demand.
National rates continue to follow seasonal expectations outside of regions impacted by Hurricane Helene and Milton.
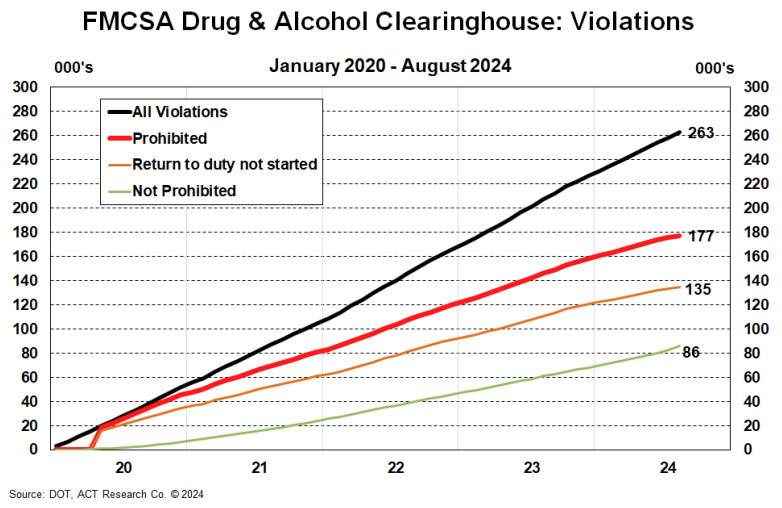
Clearinghouse regulations taking effect in November could impact over 100,000 drivers with “prohibited” status.
Inflation continues to fall, and more interest rate cuts are likely, but neither will impact the market until 2025.
What’s Happening: Aside from regional spikes, demand followed seasonal expectations.
Why It Matters: The market environment remains soft, with no change imminent.
Demand deviated from typical seasonality in early October, with a noticeable volume increase likely driven by the hurricanes and port strikes. However, the disruption was short-lived, and demand trends have returned to levels observed during this period in 2022 and 2023. As November begins, winter weather and holiday demand will likely create more volatility.
The Sonar Contract Load Accepted Volume Index (CLAV) measures accepted load tenders moving under contractual agreements. It is similar to the Outbound Tender Volume Index (OTVI) but removes all rejected tenders.
CLAV data shows demand increased leading up to the port strikes and hurricanes and then returned to typical seasonal levels in mid-October. The index will likely contract in the coming weeks before increasing again ahead of the holidays. Additional hurricanes and severe winter weather remain risks that could create demand volatility.

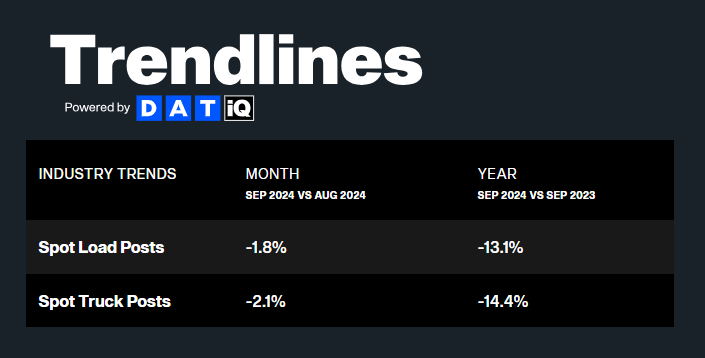
DAT reports that September spot load postings were down 1.8% month-over-month and nearly 13% year-over-year. The month-over-month decline mirrors August trends and indicates that the market may be cooling in line with seasonal expectations. The sequential freight reduction in September likely results from increased API utilization and fewer business days. Despite the pullback, this outcome is an improvement from the 12.3% month-over-month decline and 43.4% year-over-year decline in September 2023.
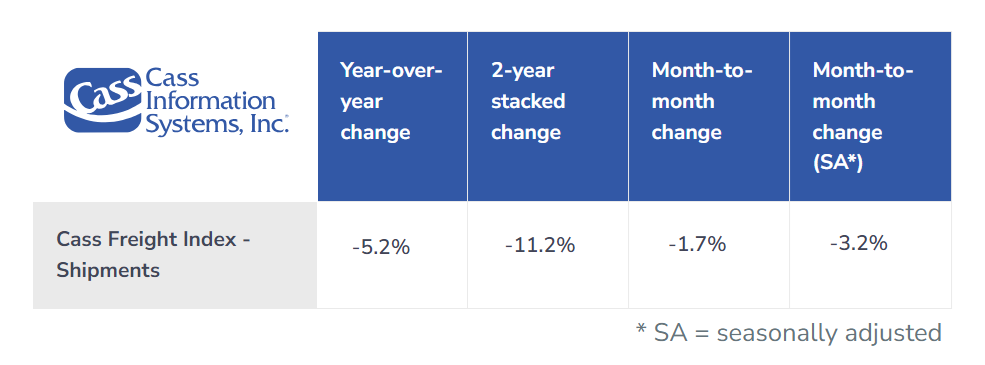
The Cass Freight Index’s shipments component is a good indicator of overall market health because it encompasses both spot and contract freight based on bill data. The September reading shows shipments declined by 3.2% month-over-month on a seasonally adjusted basis. However, the 1.7% unadjusted decline is similar to DAT spot post data, indicating that contract and spot markets followed similar patterns in September. We expect volumes to rebound in October due to recent disruption plus the holiday and end-of-year demand push.
What’s Happening: Supply remains plentiful even amid increased demand.
Why It Matters: Strong capacity levels will limit any short-term spot rate increases.
In recent weeks, the hurricanes and port strike disrupted routing guides and caused a seasonal deviation. However, abundant capacity and limited spot market demand mitigated the impact of these events.
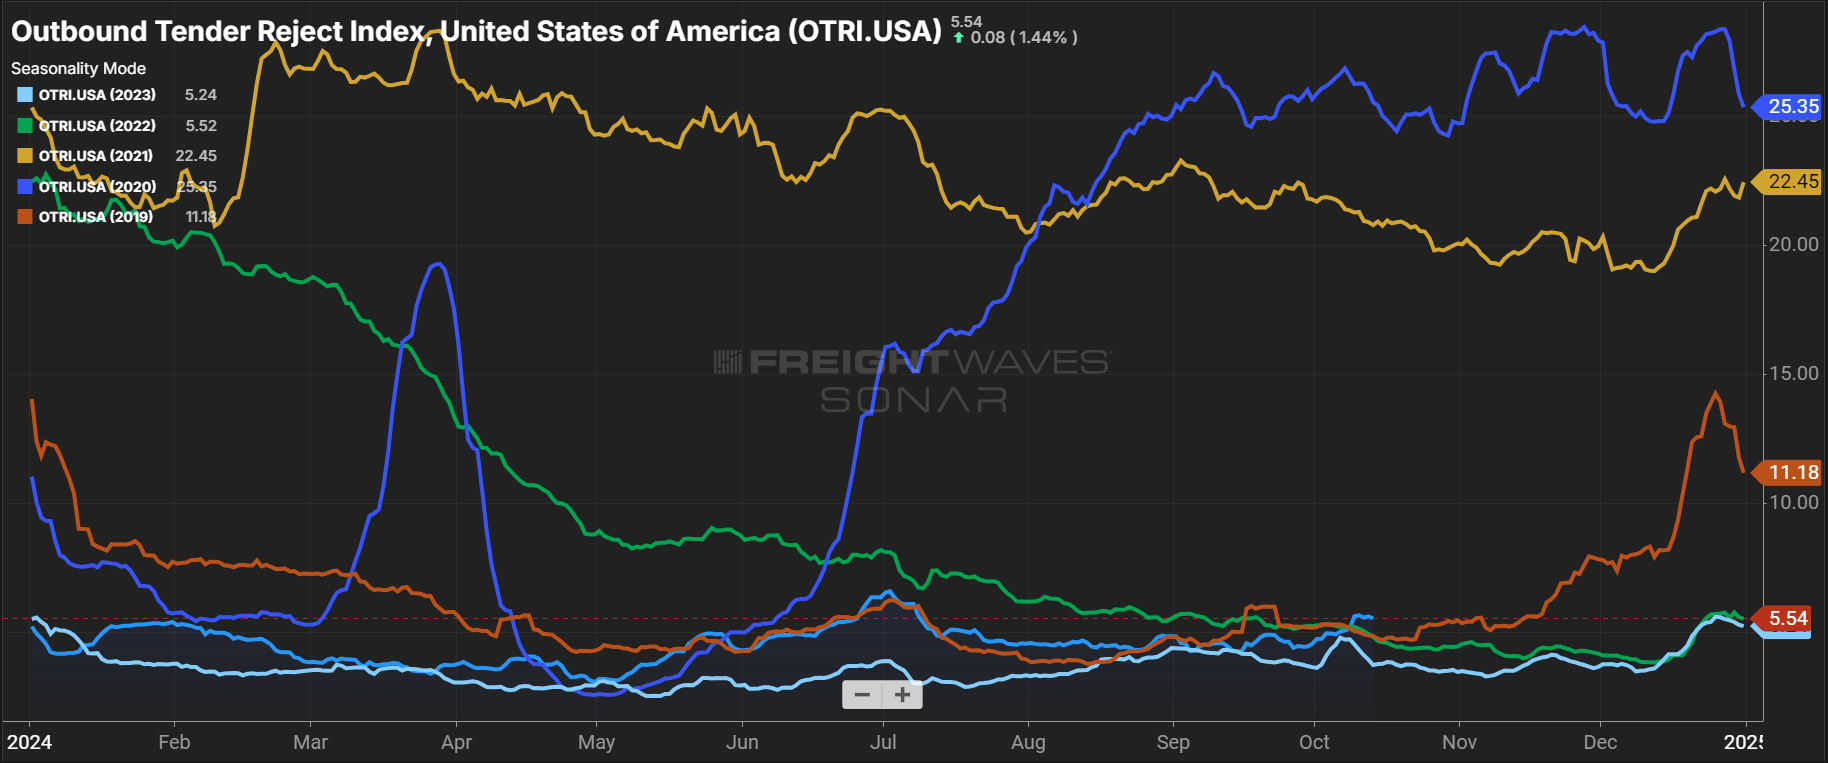
The Sonar Outbound Tender Reject Index (OTRI), which measures the rate at which carriers reject the freight they are contractually required to take, deviated slightly from 2023 trends. In October, demand typically eases, and capacity opens up. However, recent disruptive events caused regionalized volatility and a marginal increase in tender rejections at the national level. Conditions should continue to cool as November approaches, except for reefer markets, where tender rejections have reached the highest level in over two years.

The DAT Load-to-Truck Ratio measures the total number of loads relative to the total number of trucks posted on its spot board. The most recent reading shows three consecutive months of declines, confirming the market is cooling in line with seasonal expectations. Interestingly, rising rejection rates did not impact recent load-to-truck data, indicating that the spot market is not experiencing the pressure that typically comes with routing guide disruption.

The Morgan Stanley Dry Van Freight Index is another measure of relative supply; the higher the index, the tighter the market conditions. The black line with triangle markers on the chart provides a great view of what directional trends would be in line with normal seasonality based on historical data dating back to 2007. Despite recent disruptions, the latest reading shows no meaningful activity or demand increase as of mid-October, with trends returning to the 10-year average amid seasonal cooling.
Morgan Stanley Dry Van Truckload Freight Index

What’s Happening: Spot rates spiked in regions impacted by storms, but otherwise remained flat.
Why it Matters: Rate patterns should continue to follow normal seasonality.
Recent disruptive events caused spot rates to rise sharply in late September and early October. These spikes coincided with increased tender rejections triggered by travel delays and road closures in affected areas. Most of that volatility has subsided and rates are expected to normalize during the second half of October and rise again as the holidays approach.
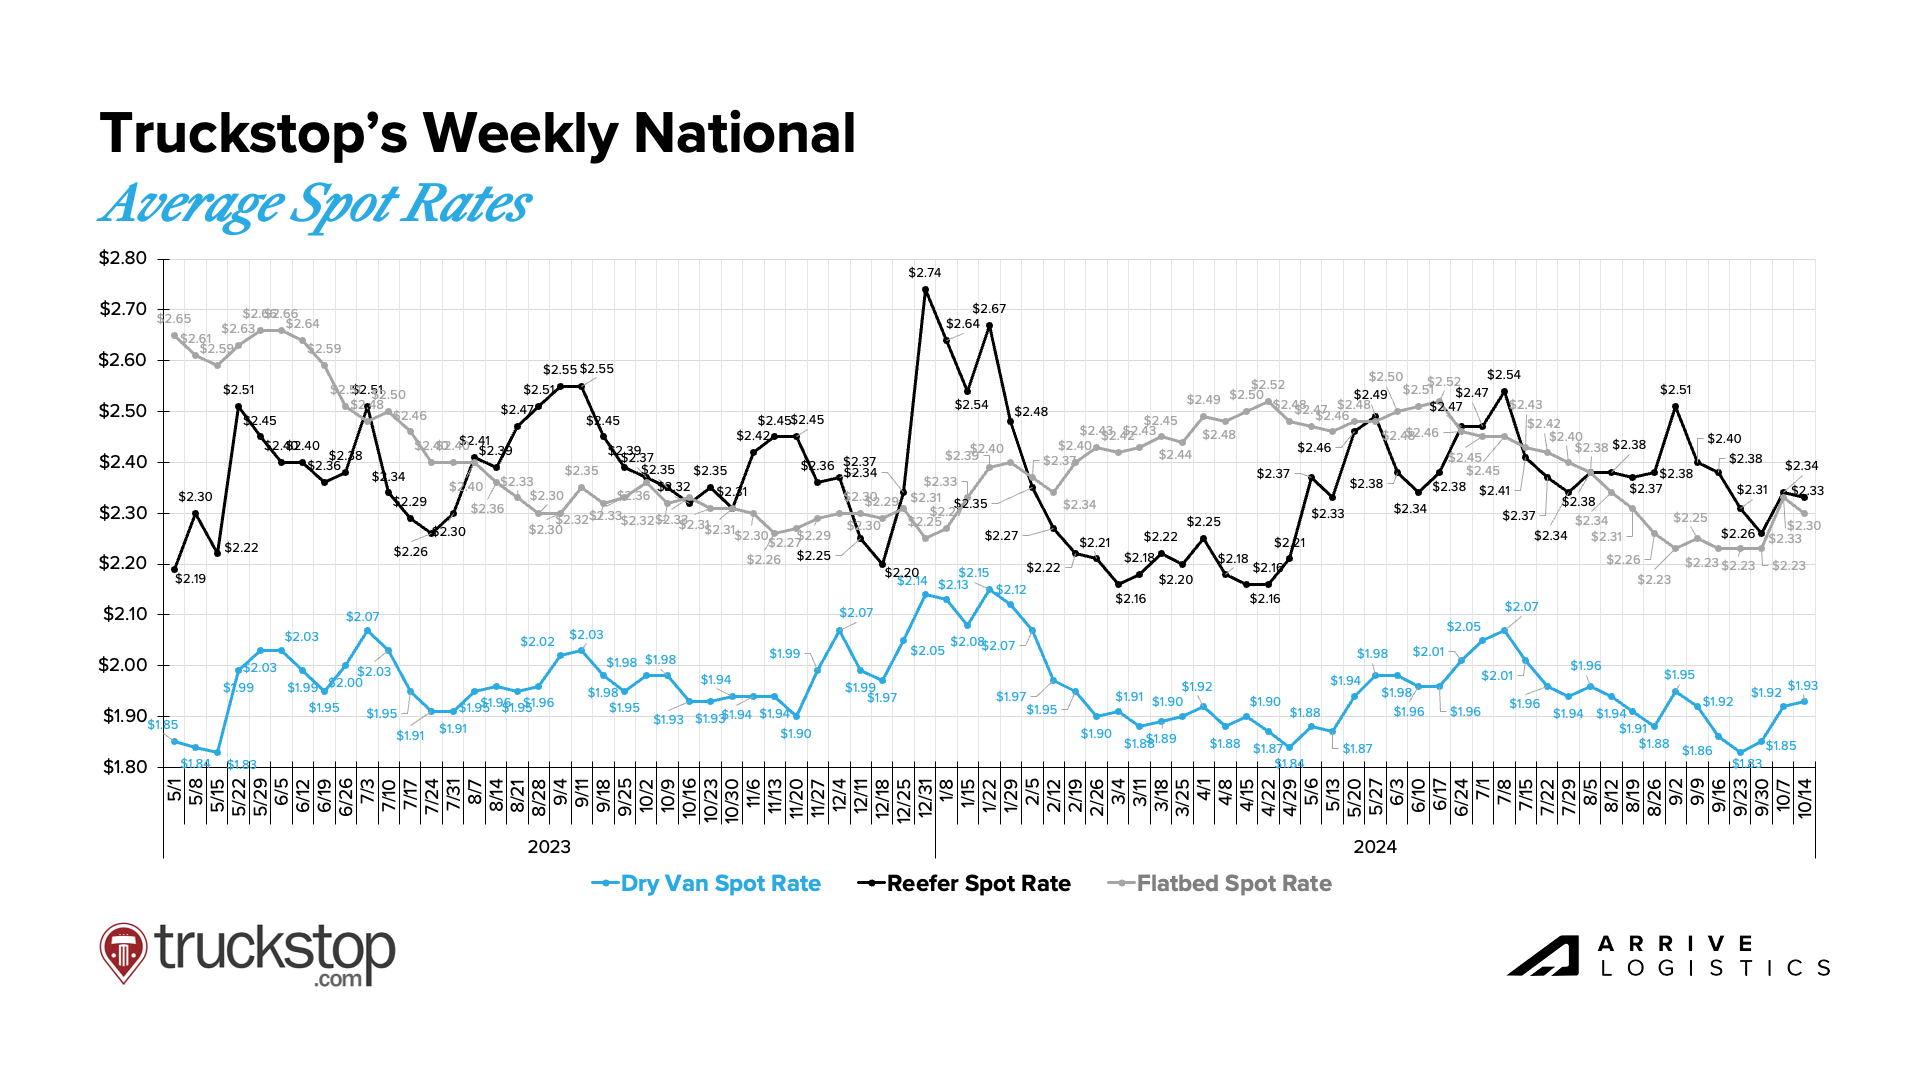
According to DAT, spot rates (including fuel) declined across all three modes from August to September. Dry van rates fell by $0.03 to $1.97 per mile. Reefer and flatbed rates also fell by $0.03 to $2.37 per mile and $2.38 per mile, respectively. However, considering fuel prices dropped in September, this data indicates that linehaul rates have been relatively steady.
DAT Monthly Rate Trends
National diesel prices remain low but have ticked up in consecutive weeks, likely due to supply chain disruptions caused by Hurricanes Helene and Milton. Disruptions aside, fuel prices are steady, production remains strong and inventories are full. While current fuel prices should hold, winter weather and escalating conflicts in the Middle East remain risks.
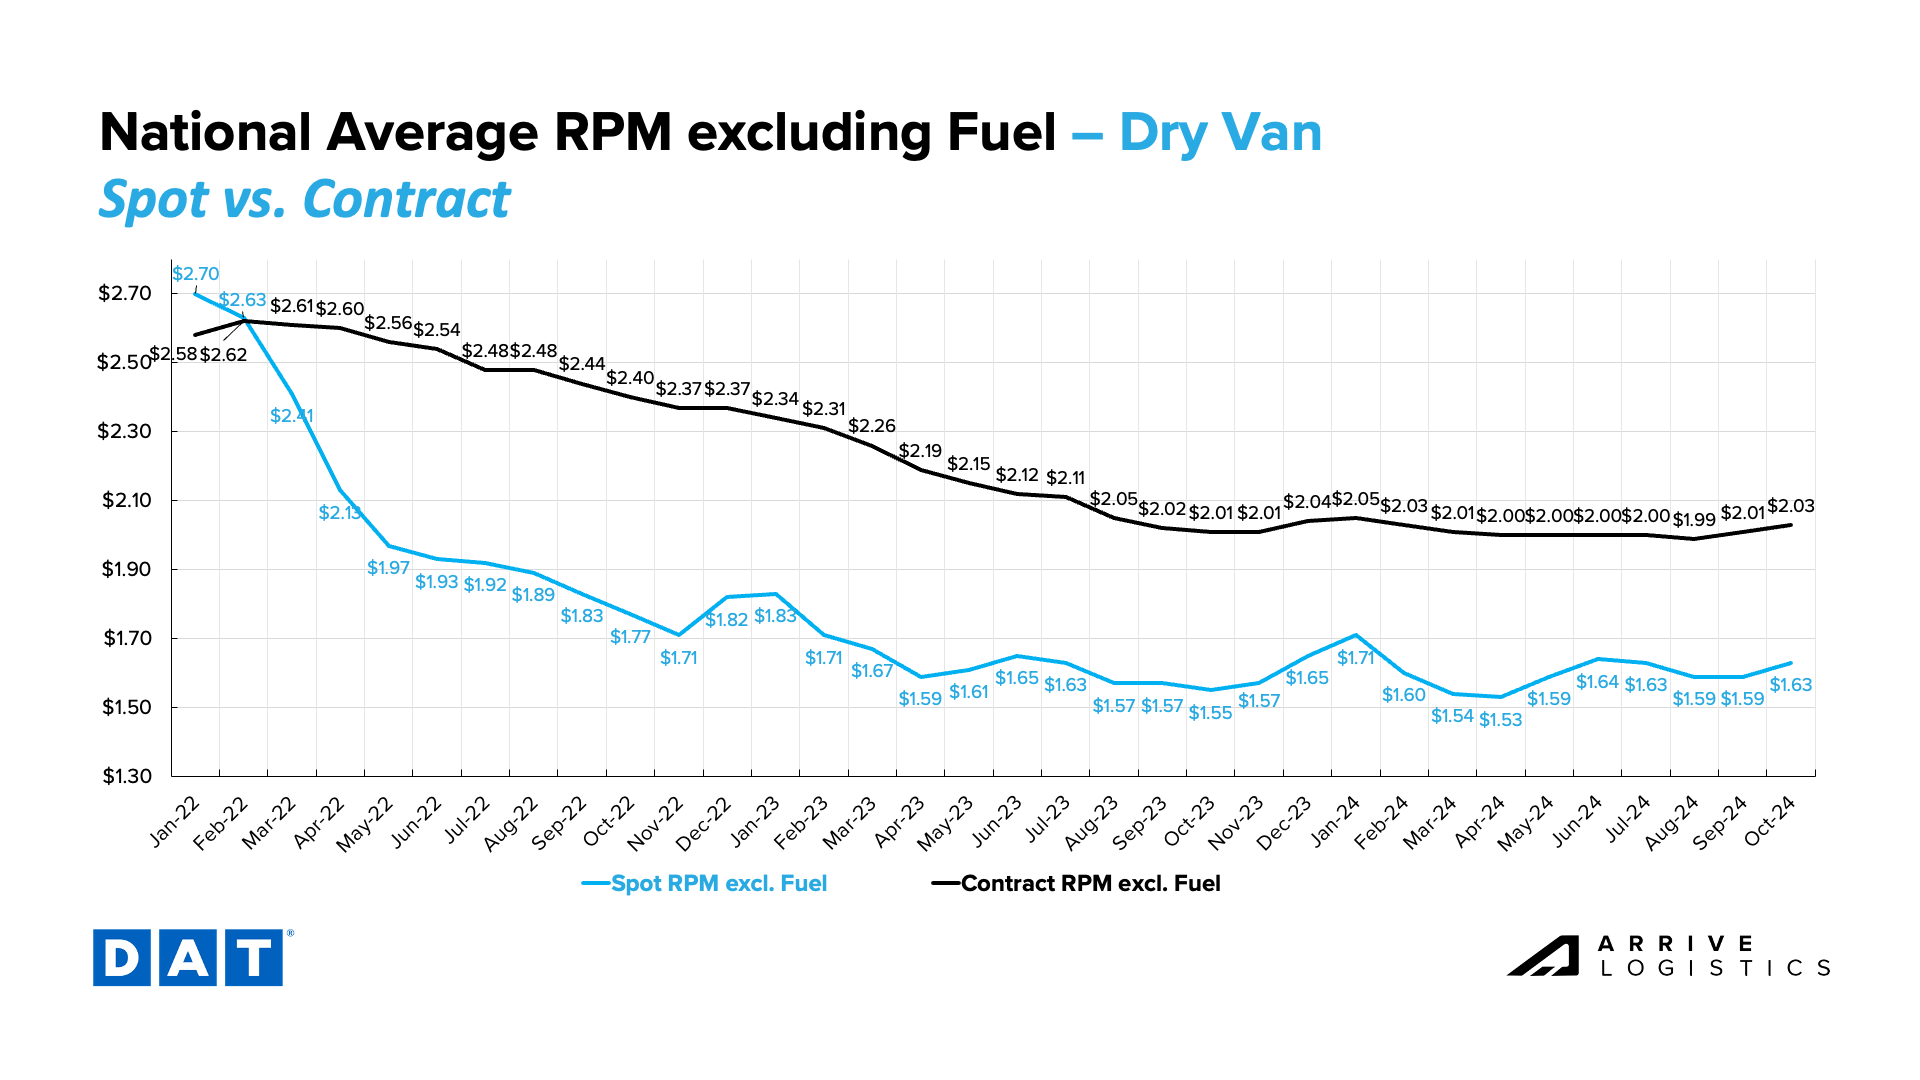
DAT dry van data shows spot rates were flat in September and then increased in early October, especially in regions impacted by Hurricane Helene and Milton. As conditions in these areas normalize, rates will likely return to levels observed in October 2022 and 2023.
Contract rates remain relatively flat, with marginal increases in September and early October. As the RFP season begins, shippers may look to lock in long-term contracts to insulate themselves against expected rate increases in 2025.
The spot-contract rate gap remains relatively wide at $0.40 per mile, excluding fuel, indicating the market is still safe from disruption.
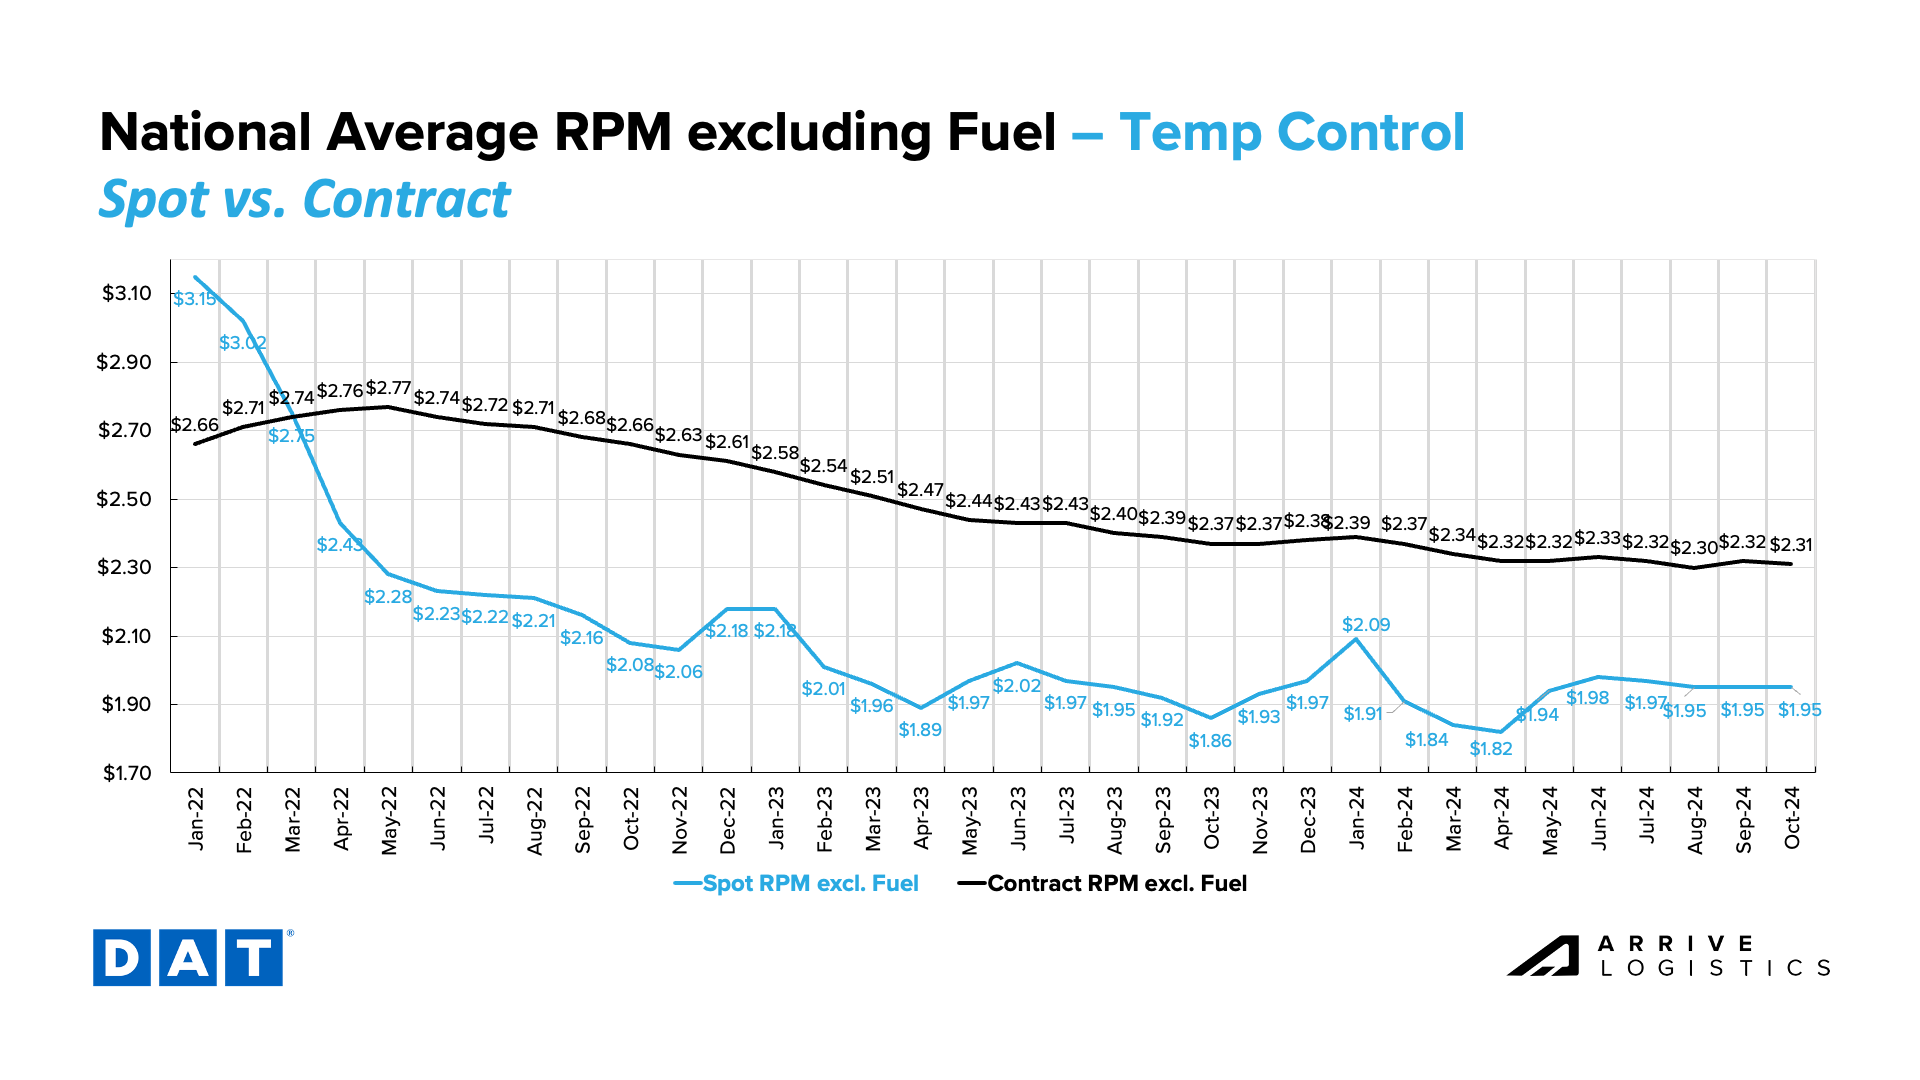
Early October reefer trends differed slightly from dry van trends. Spot rates remain at $1.95 per mile, excluding fuel, and contract rates fell by $0.01 to $2.31 per mile.
This year’s spot rate trend is noticeably stronger than October 2022 and 2023, which had drops of $0.08 per mile and $0.06 per mile, respectively. Reefer market disruption should continue through year-end, causing rates to increase sharply.
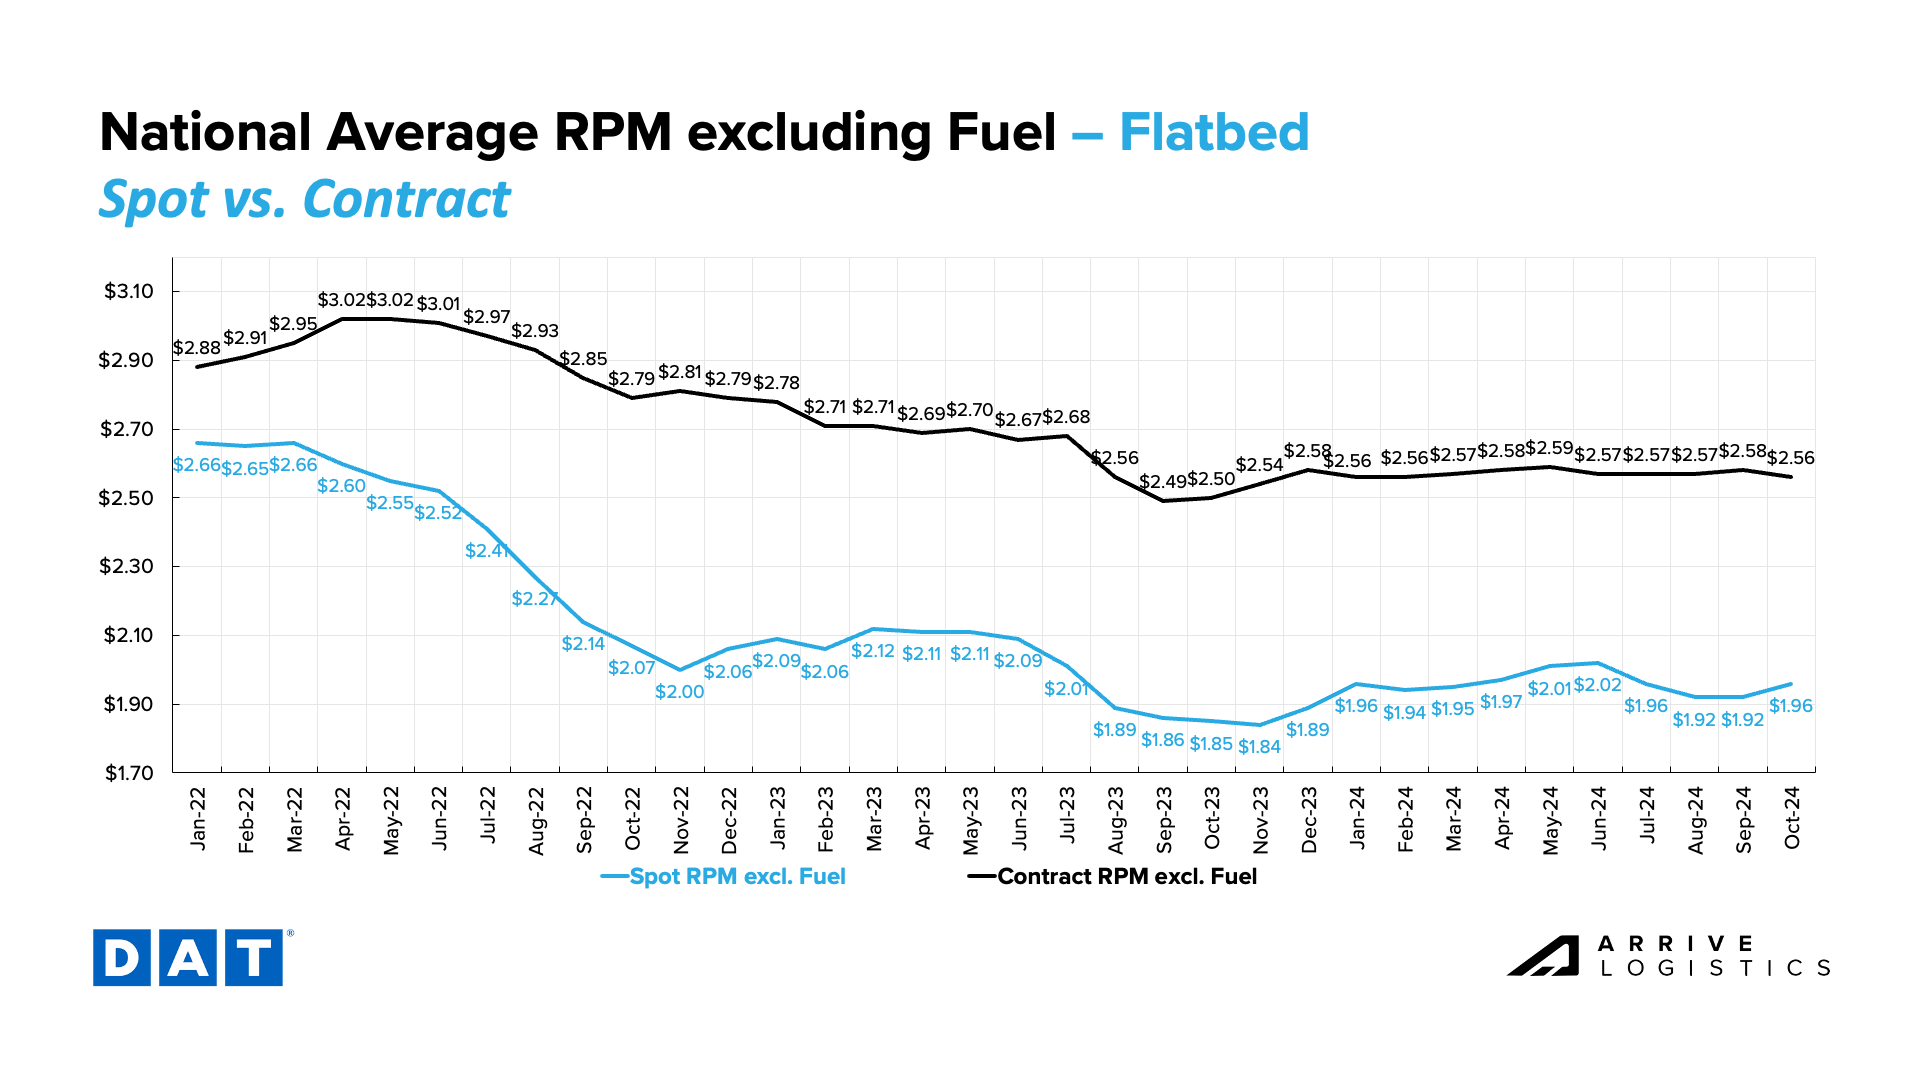
Flatbed rates remain relatively steady but rose slightly in early October, likely due to increased recovery-related demand in regions impacted by Hurricanes Helene and Milton. Contract rates are still well above spot rates at $2.56 per mile.
What’s Happening: Recent events had a nominal market impact.
Why It Matters: Inbound demand and rates are down but outbound rates are rising.
What’s Happening: Cross-border Mexico markets remain quiet.
Why It Matters: Shippers are pricing aggressively to lock in low rates.
What’s Happening: The LTL market remains steady.
Why It Matters: No major fluctuations are expected in the near future.
What’s Happening: Temp controlled supply was tested by recent volatility.
Why It Matters: Rates have settled, but it remains clear that market recovery is furthest along for temp controlled capacity.
East Coast
Midwest
South
West
Pacific Northwest (PNW)
What’s Happening: Demand continues to decline.
Why It Matters: Increases are unlikely until February.
What’s Happening: Beginning November 18, 2024, SDLAs will be required to remove the commercial driving privileges of over 100,000 drivers with “prohibited” Clearinghouse status.
Why It Matters: Supply could take a significant hit depending on the number of drivers impacted.
Supply remains status quo due to resilient carriers exiting the market more slowly than expected. This trend should continue through 2024 and into early 2025, but carrier exits could accelerate if rates remain low. Driver availability is still high, but Clearinghouse regulations going into effect in November could impact many drivers.
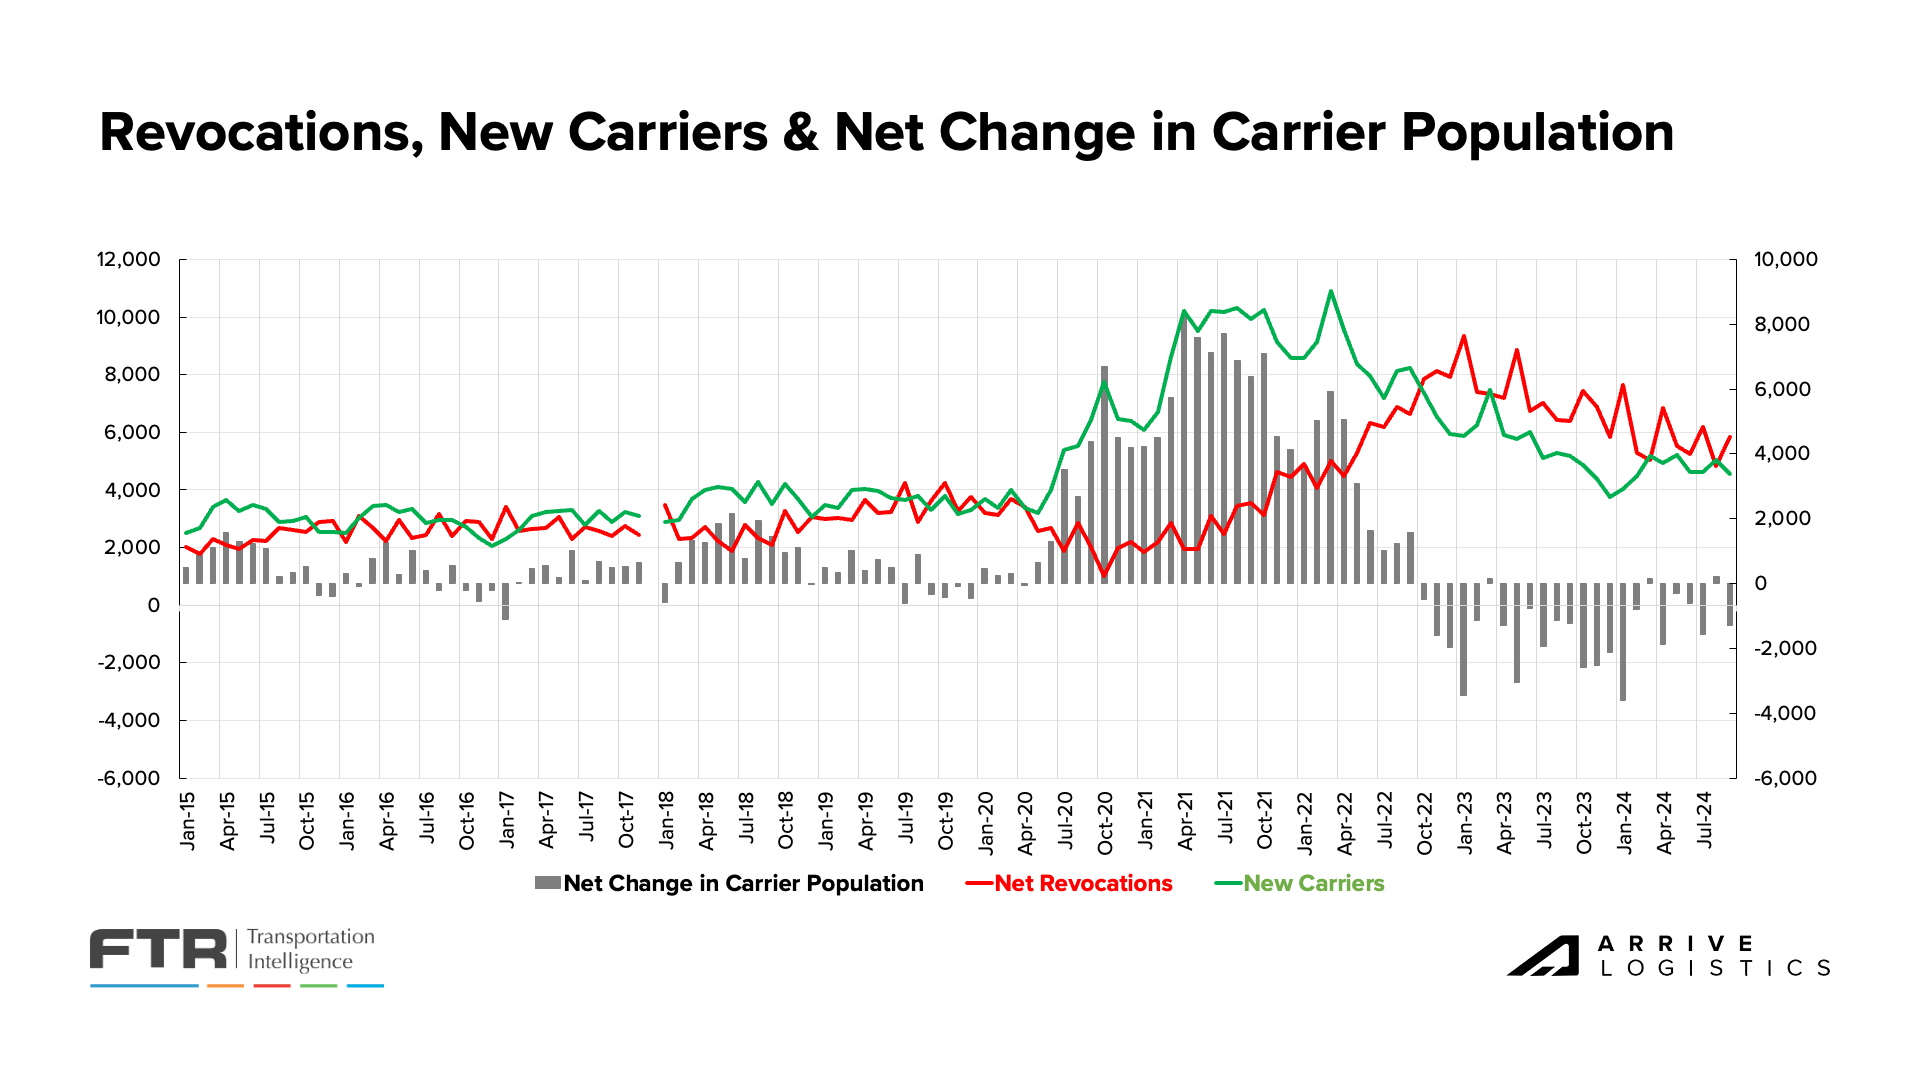
FTR’s latest revocation data shows a carrier population decrease for the 21st time in the last 24 months. Revocations ticked up month-over-month, while new entrants declined sequentially, indicating carriers continue to struggle or exit the market amid persistently low revenues. However, many may be holding out for a market inflection in early 2025.
Trucking jobs fell by 700 on a seasonally adjusted basis in September, a symptom of poor spot rate conditions and increased contract rate competition. Nearly 12,800 trucking jobs have disappeared since April 2024, including 4,400 in the past four months. The decline will likely continue as private fleet investment decelerates and carriers struggle to operate within the current rate environment. However, recent spot volatility plus the upcoming retail peak season could mitigate further job losses until early next year.
One of the more notable impacts on the capacity environment could occur on November 18th, 2024, when drivers with prohibited status will become ineligible for employment by law. According to ACT Research, approximately 177,000 drivers currently have prohibited status. Though many are currently unemployed, all drivers with this status have all been eligible for employment until now. Removing this population from the workforce amid holiday peak season volatility could create significant disruption.
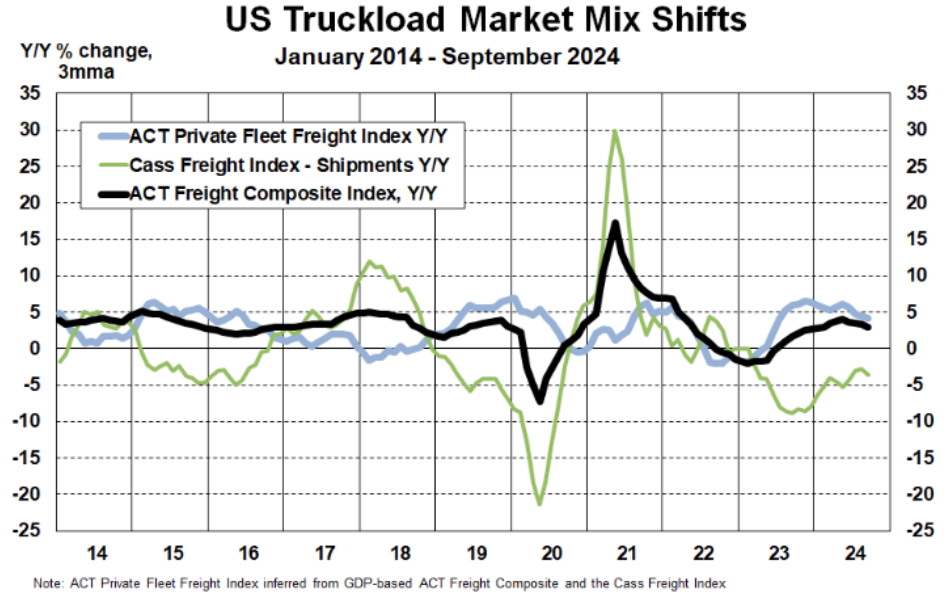
We continue to monitor the evolving role of private fleets as they increase their share of for-hire freight annually despite year-over-year shipment volume declines. With less freight available, for-hire carriers must negotiate aggressively on rates to maintain volume and revenue, which applies downward pressure on the market. If this trend continues and private fleet participation in the for-hire market grows, it could extend the current rate and supply environment.
FTR’s FTR’s latest truck utilization forecast shows trends directly in line with the 10-year average of 92%, up from 91% last month. Utilization will likely approach 95% by the end of 2026 as equipment orders continue to decline and trucking employment stabilizes.

What’s Happening: Demand should remain steady through year-end.
Why It Matters: Despite some up and downside risks, the market is still safe from demand-related disruption.
Forecasts continue to show stable freight volume. Both upside and downside risks are present, but there is no clear indication that demand shifts will impact the market in the near term. The latest National Retail Federation (NRF) for year-over-year import volume increases for the remainder of 2024, with 25 million total TEUs expected.
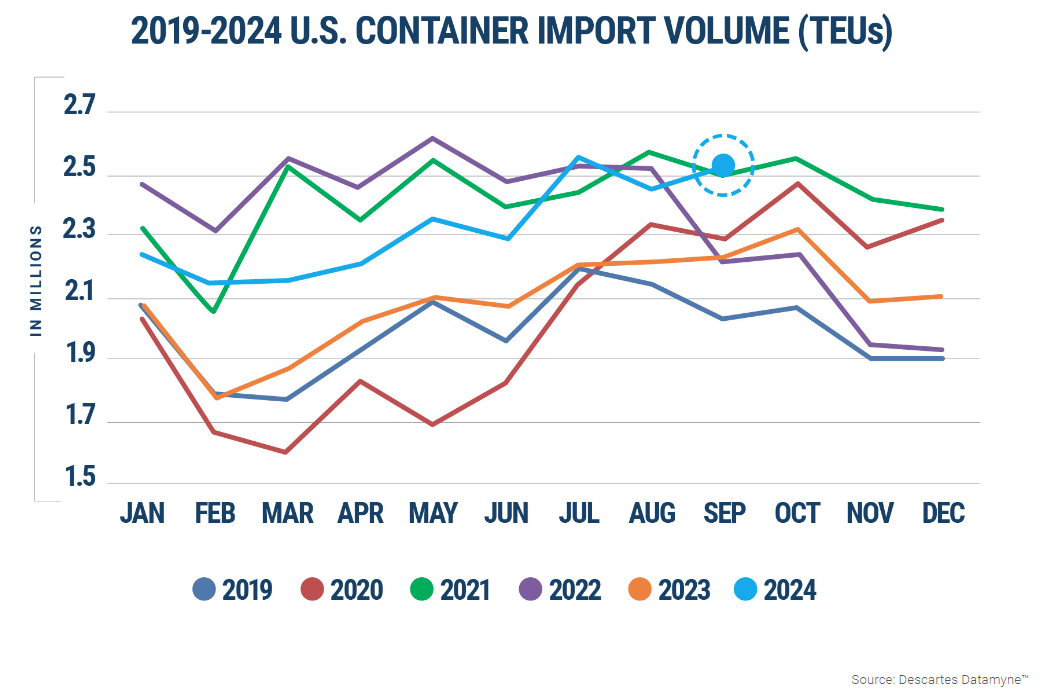
While the East and Gulf Coast port strike is on hold until mid-January, shippers pushing freight forward during the summer months to avoid potential disruption led to a significant year-over-year increase in import volume. That surge has subsided, and imports for the rest of the year should be closer to 2023 levels than those from the first nine months of 2024. Despite the looming threat of the port strike resuming, major import forecast changes are unlikely for the remainder of the year as almost all holiday-related freight has arrived.

Recent Descartes data tells a slightly different story from the NRF forecast, showing a month-over-month import increase in September. Regardless, the overarching trend of increased imports over the summer remains true. Descartes notes that imports from China have been the highest on record over the past three months, likely due to stateside shippers rushing to move freight before the port strike and potential tariff increases.
Ultimately, the consensus is that imports will return to normal seasonal levels over the remainder of the year, but disruption is possible in early 2025 if the port strike resumes.
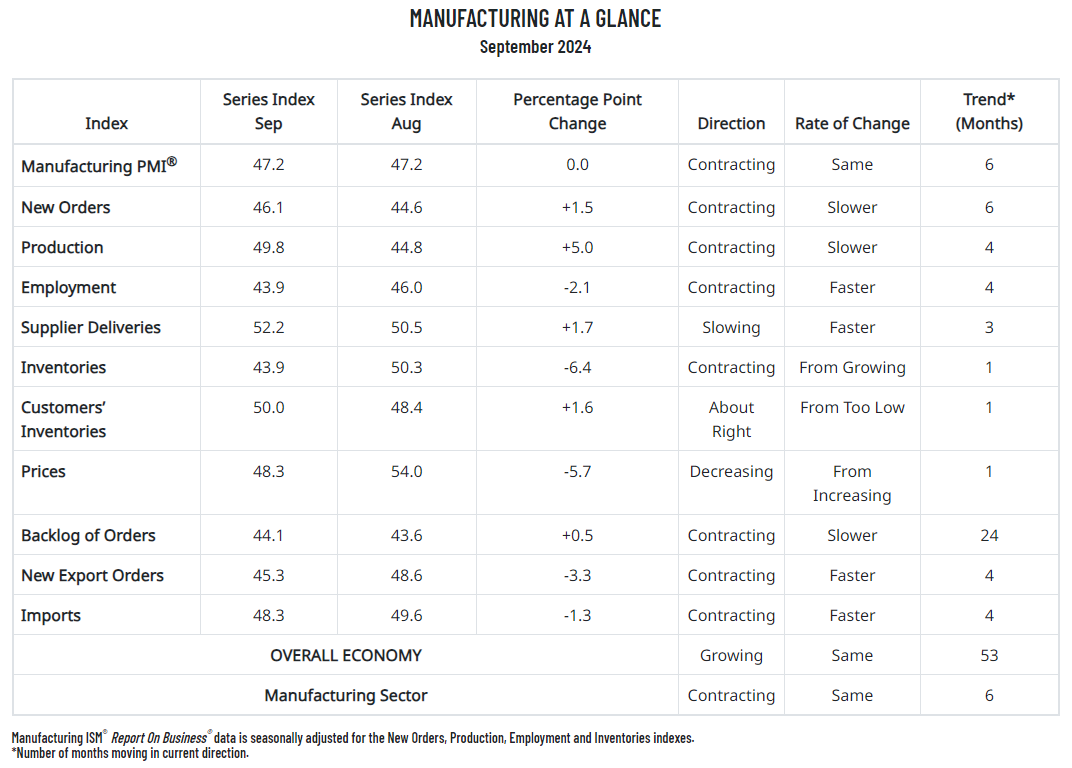
The manufacturing sector has contracted in 22 of the past 23 months, including the last six months in a row. The most recent ISM reading of 47.2 matched August and clearly illustrates weak demand. However, ISM notes that a reading above 42.5 indicates economic expansion, and September was the 53rd consecutive month with a reading above that threshold. As interest rates continue to decline and spending picks up, manufacturing demand could increase and drive the index over 50 in 2025.
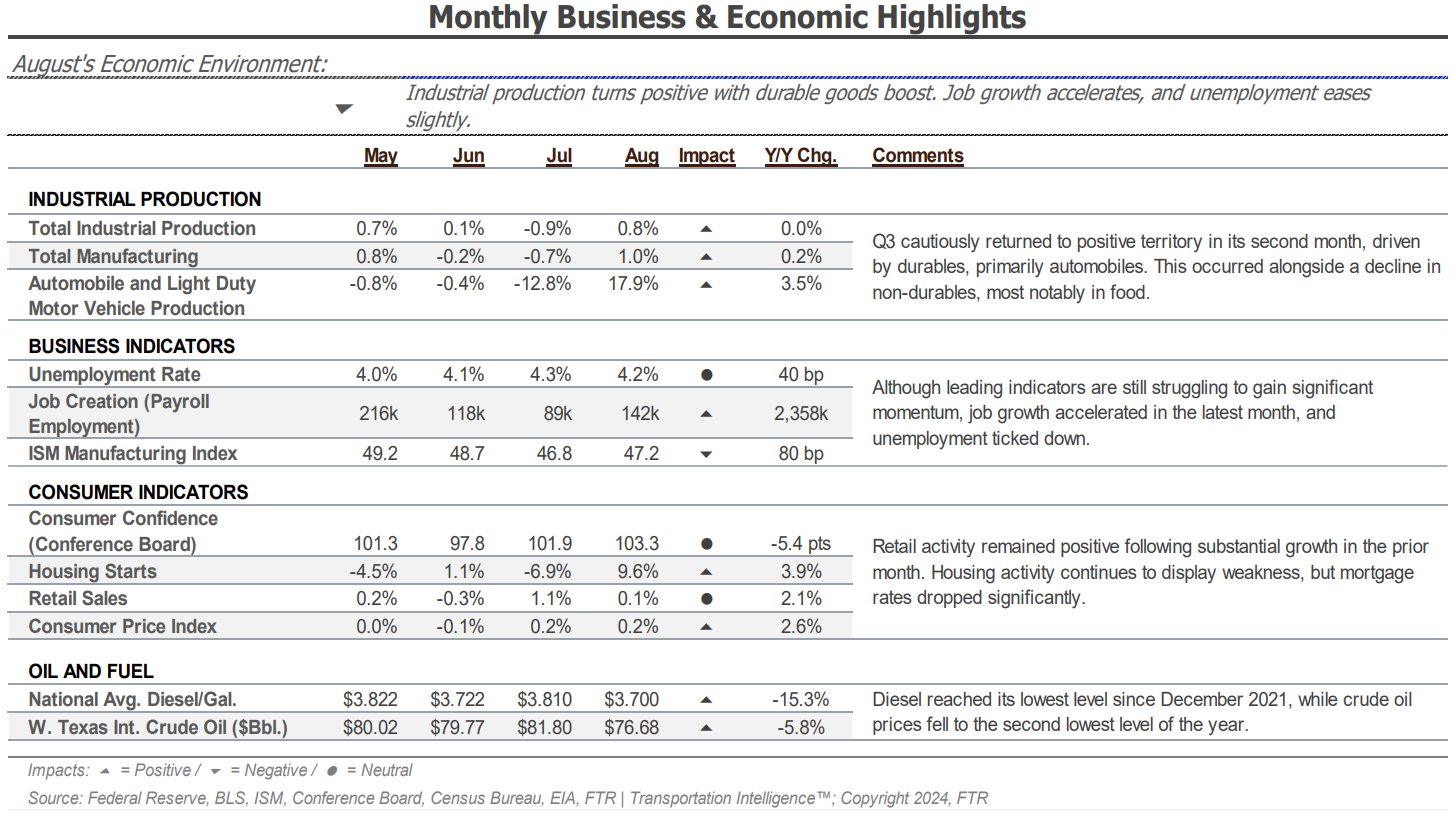
Economic trends in freight-related industries remain soft. Manufacturing was relatively stable while unemployment ticked down. Retail activity is still a bright spot, but the housing market continues to show signs of weakness. However, with interest and mortgage rates falling, housing could get a boost in 2025 and help drive freight demand.
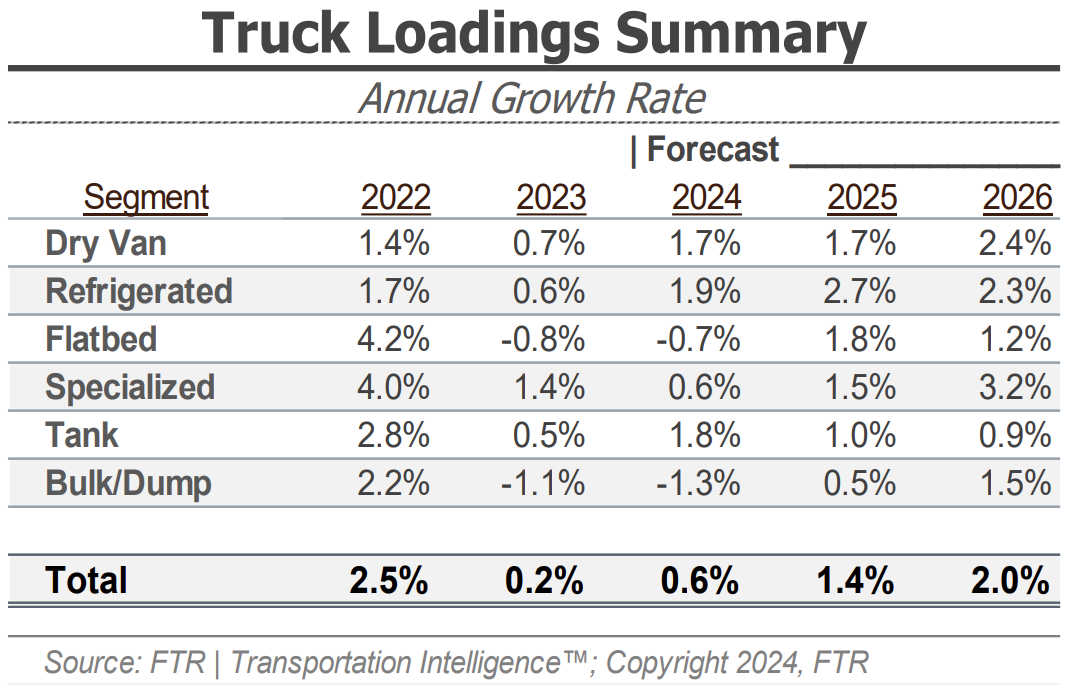
FTR made a meaningful positive revision to its truck loadings forecast, projecting total truck loadings to increase by 0.6% in 2024, up from 0.2% last month. The forecast calls for a growth of 1.7% for dry van loadings and 1.9% for reefer loadings. Meanwhile, flatbed loadings are projected to decline by 0.7%, an improvement from last month’s forecasted decline of 2.2%. Ultimately, 2024 should end with slightly more loadings than in 2023, but recent positive revisions combined with improved 2025 expectations could drive positive demand changes moving forward.
What’s Happening: Consumers remain frugal yet cautiously optimistic.
Why It Matters: This trend will likely continue until interest rates and inflation fall further.
Inflation continues to decline and move closer to the historical 2% target. The reading of 2.4% in September was the lowest since 2020. As a result, we expect more rate cuts in the near future, which would be inflationary and an upside risk to demand. As interest rates decline, consumer spending and housing activity should pick up and positively impact freight demand in 2025.
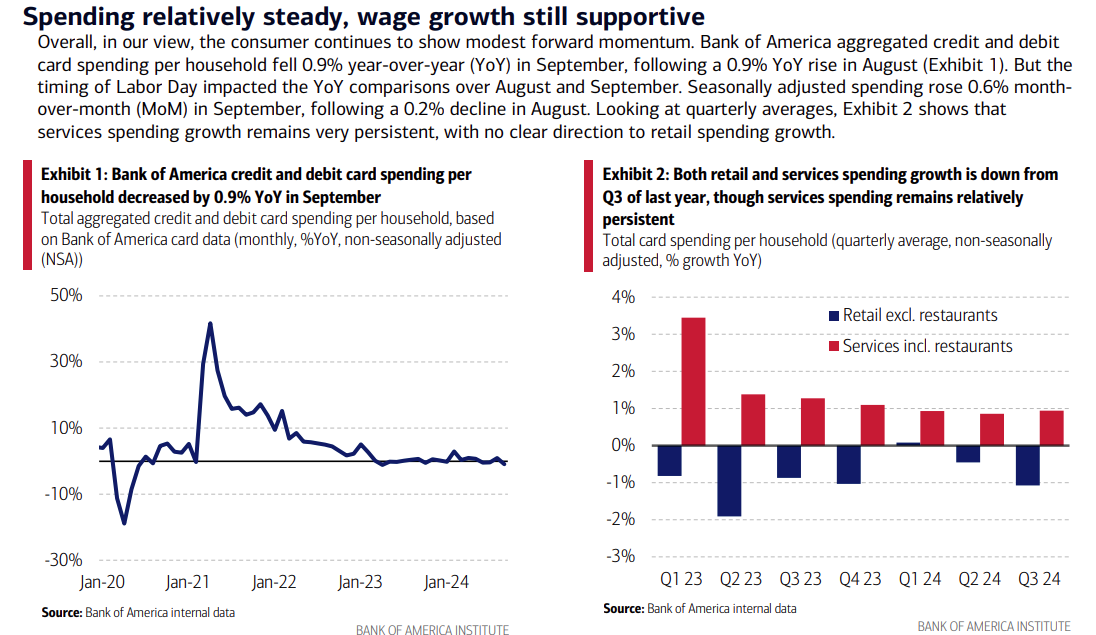
Recent Bank of America credit card data shows spending declined 0.9% year-over-year in September after rising 0.9% year-over-year in August. However, spending increased just 0.6% month-over-month on a seasonally adjusted basis as consumers remained cautious. Services sector spending increased on a quarterly basis, but retail spending continued to shrink slowly. Ultimately, consumers are expected to maintain relatively stable spending levels until interest rates fall further and wages continue to grow.
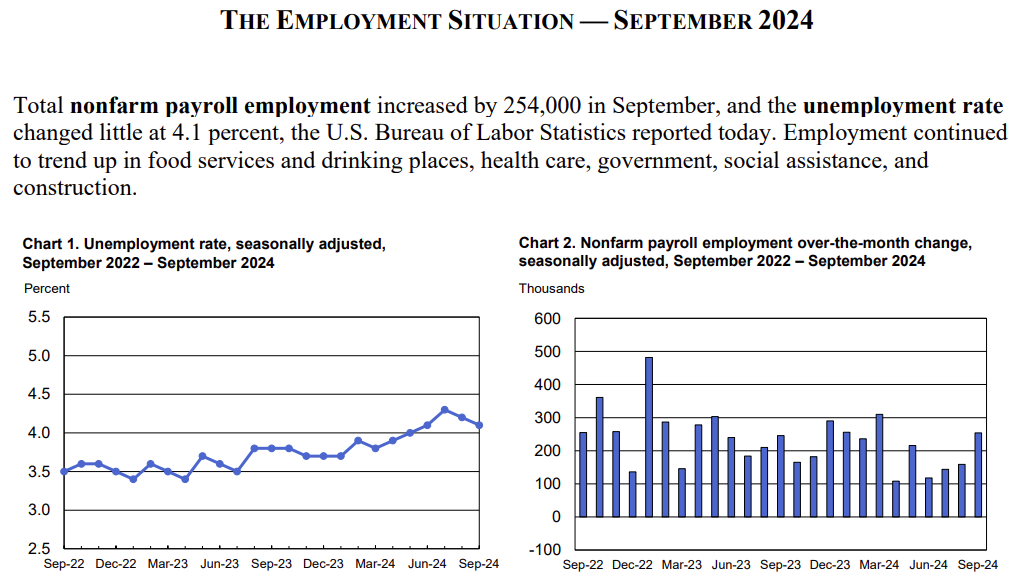
The labor market is steady. Unemployment fell to 4.1% in the most recent reading, indicating that there is no significant change or cause for concern on the labor front. A recession remains possible but looks increasingly unlikely, and declining interest rates should help mitigate that risk.
Over the past few weeks, the freight market has been tested by three potentially disruptive events. Each time, capacity absorbed the additional volatility without any major impact on a national scale. Regional impacts were more significant, but even those markets normalized quickly as urgent recovery efforts winded down.
Outside of these events, there have been no meaningful demand spikes or capacity erosion this year. As a result, the market continues to follow normal seasonality and remains relatively stable ahead of the holiday season.
Moving forward, rates should mostly hold steady, with some increased movement as the holidays approach, as well as in areas impacted by the Hurricanes and regions where winter weather could create disruptions.
The Arrive Monthly Market Update, created by Arrive InsightsTM, is a report that analyzes data from multiple sources, including but not limited to FreightWaves SONAR, DAT, FTR Transportation Intelligence, ACT Research, Morgan Stanley Research, Bank of America Internal Data, Journal of Commerce, Stephens Research, National Retail Federation and FRED Economic Data from the past month as well as year-over-year. We understand market data is vital in making real-time business decisions. At Arrive Logistics, we are committed to giving you the data and insights you need to better manage your freight.

