"*" indicates required fields
"*" indicates required fields
"*" indicates required fields

Welcome to Arrive’s comprehensive outlook for national dry van and reefer truckload rates for January 2023 through December 2025. The Arrive Insights® team generated this forecast through a combination of extensive historical research and output from the predictive models built into ARRIVEnow, our proprietary technology platform.
Successfully navigating freight market ebbs and flows begins with a basic understanding of the relationship between rates and the unique components of truckload supply and demand. Simply put, high or increasing demand and tight capacity will cause upward rate pressure, whereas low or easing demand and ample available capacity will drive rates down.
By tracking directional trends for truckload demand (volume) and available capacity (trucks) in the market at any given time, we can predict rate trends with a high degree of accuracy and consistency.
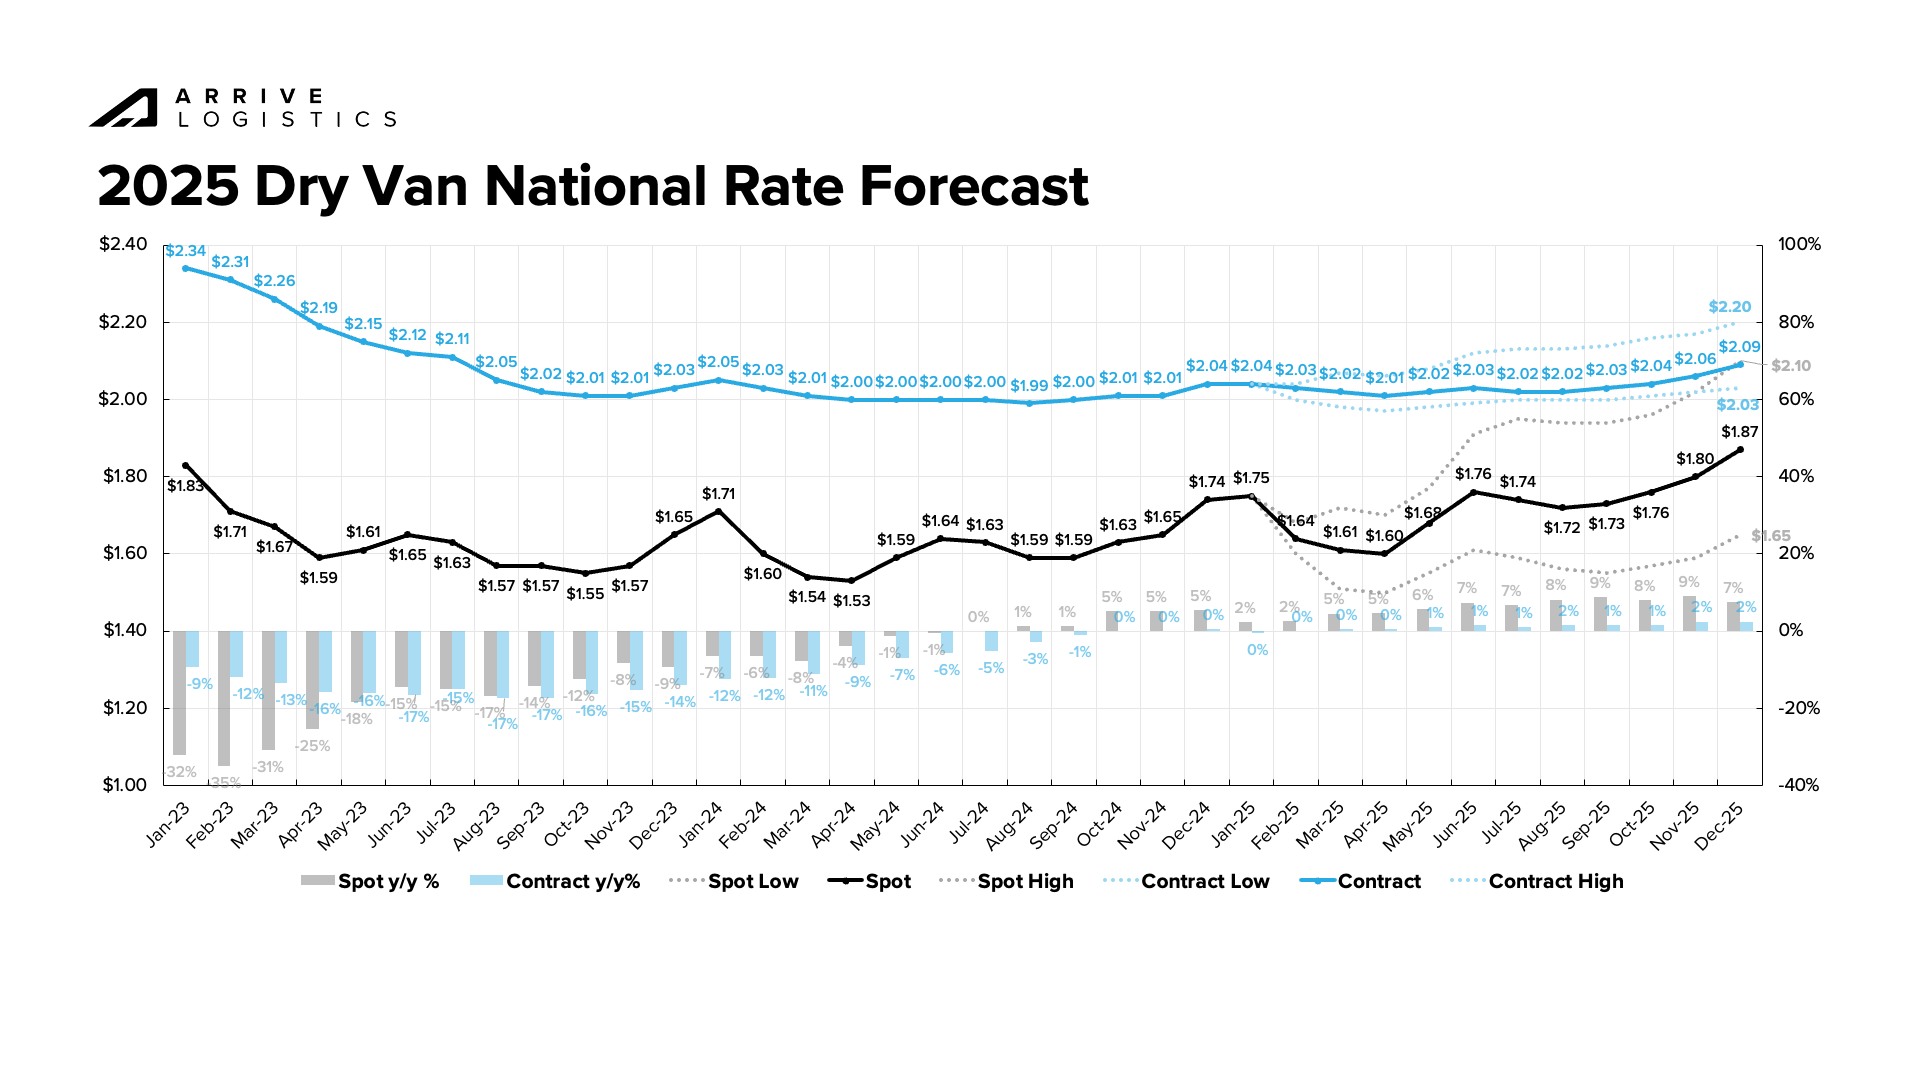
We anticipate spot rates will follow normal seasonal patterns throughout 2025, showing moderate year-over-year growth with typical periods of volatility. Contract rates have stabilized and reached a floor. Further reductions in the national average are unlikely as current rates are already nearing carrier breakeven points. However, significant near-term rate increases are also improbable as shippers maintain pricing power with national average spot rates still well below contract rates.
As the contract-spot rate gap slowly closes, the market will become more vulnerable to sustained disruption. Following a stronger Q4 peak season and weather-driven rate volatility in early Q1, conditions have eased rapidly in February. Thus, while we expect more seasonal volatility and increasing market vulnerability, a large-scale, unforeseen black swan type of event would still be required to create sustained disruption at this stage. In turn, it is difficult to precisely predict if and when spot rates will rise rapidly during the next inflationary period, especially with growing demand uncertainty due to pending tariffs.
Routing guides have been largely intact and should remain as such through at least H1 2025, with some increased vulnerability to disruption in H2 2025.
Seasonal demand will continue to drive regional or nationwide rate volatility and should make directional rate trends more predictable.
Asset carriers will face ongoing pressure from shippers to provide lower rates, making it difficult for many to operate profitably. In turn, more carriers may have to shut down operations or slow investment in their fleets, reducing available capacity in the market.
Without a meaningful capacity disruption or black swan event, we do not expect spot rates to cross contract rates. In turn, rate growth and disruption duration during the inflationary cycle will likely be muted.
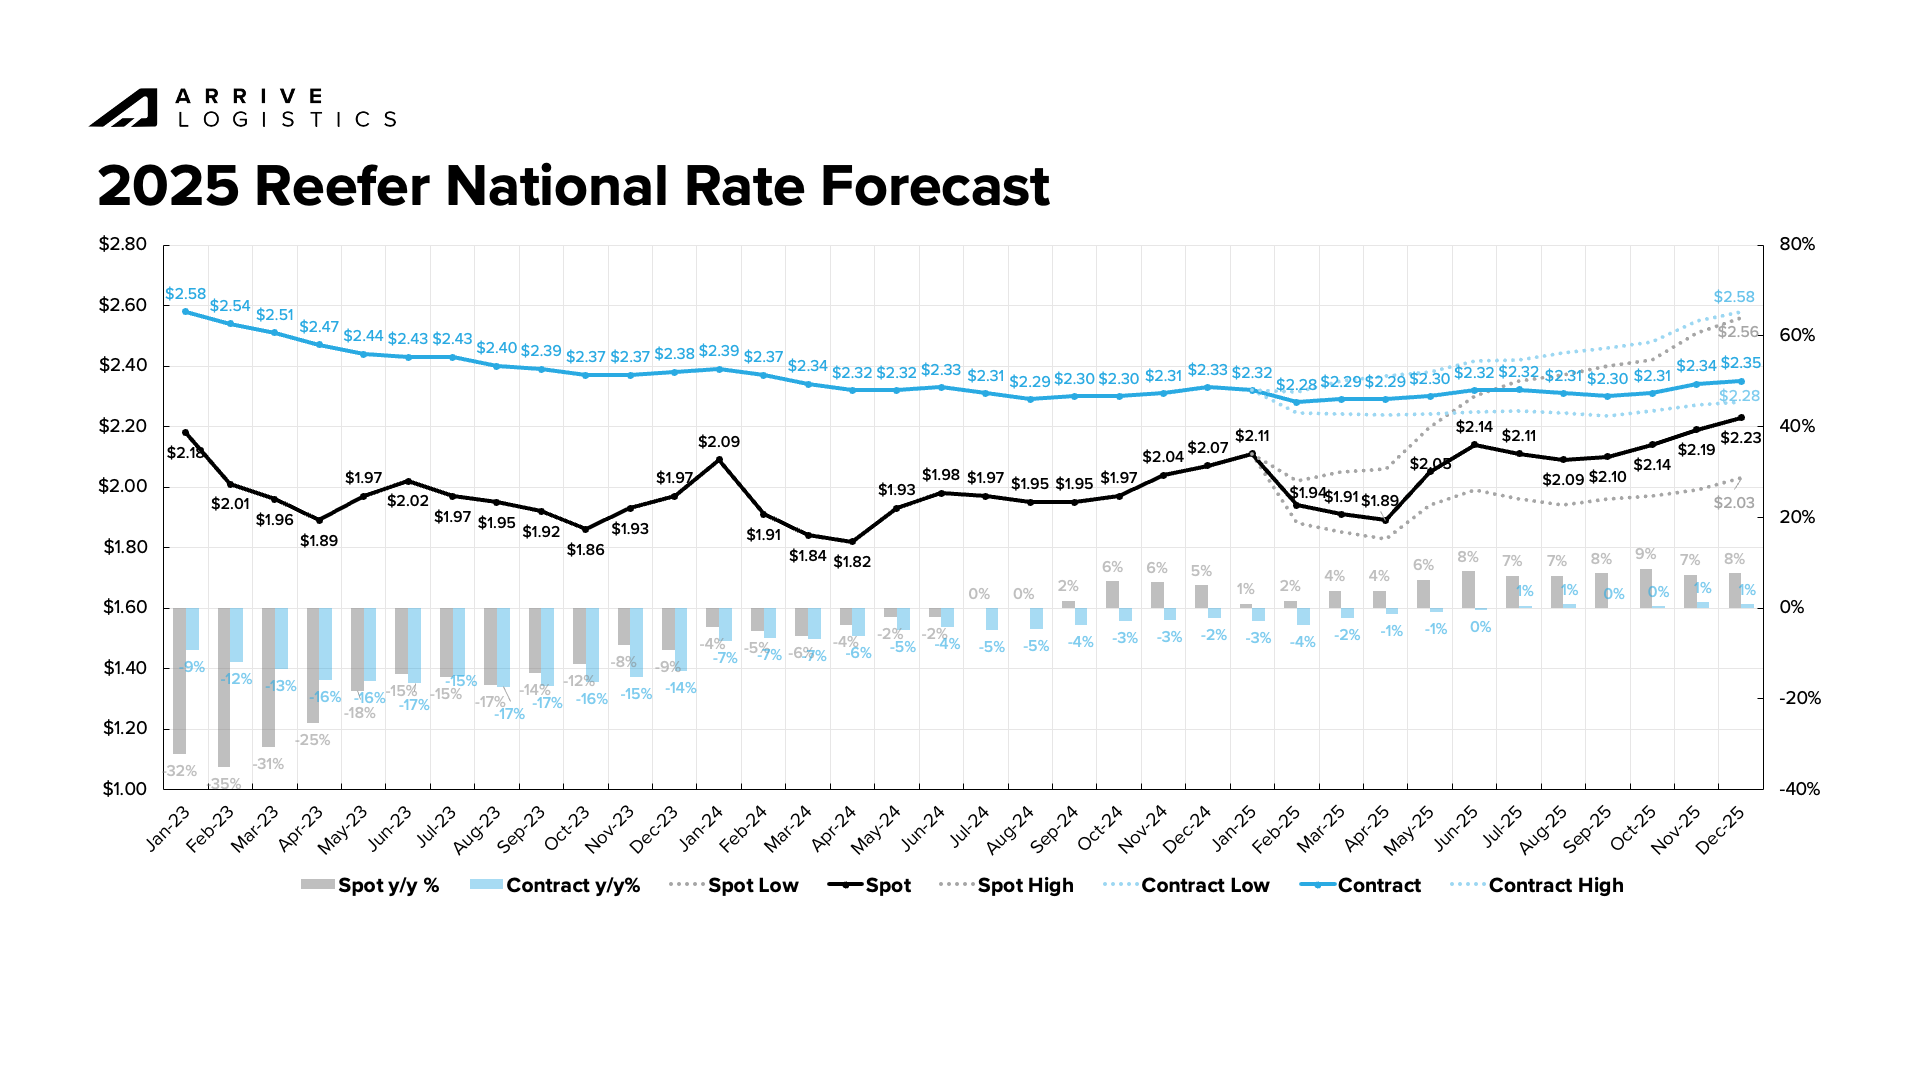
Continual reefer routing guide volatility during seasonal volume fluctuations illustrates greater vulnerability to surging demand and indicates that the freight market’s recovery may be further along for reefer equipment.
Forecast Indicates:
Van spot rates will reach a peak year-over-year growth rate of 9% in Q3 2025.
Van contract rates will reach a peak year-over-year growth rate of 2% in Q4 2025.
Reefer spot rates will reach a peak year-over-year growth rate of 9% in Q3 2025.
Reefer contract rates will reach a peak year-over-year growth rate of 1% in Q4 2025.
The dry van spot-contract rate spread will reach a low of $0.22 per mile late in Q4 2025.
The reefer spot-contract rate spread will reach a low of $0.12 per mile late in Q4 2025.
Freight tonnage alone appears unlikely to significantly improve trucking conditions in 2025, but a resilient economy and steady consumer behavior will support relatively stable demand for now. However, both upside and downside risks are present due to the potential for tariffs and corporate tax cuts this year.
Stable routing guides should continue to drive strong contract market share as limited demand shifts to the spot market.
Domestic manufacturing has had some recent green shoots, moving into a mild expansionary environment in early 2025. Corporate tax cuts and nearshoring could lead to manufacturing growth over time, but it is unlikely to be a major demand driver in the short term.
Some importers responded to the tariff threat by pulling forward inventories, but high storage costs and uncertainty around if and when the tariffs will be implemented are limiting the extent of this approach.
Cooling labor market trends pose a greater downside demand risk, but overall labor conditions remain stable. If the latter continues, we expect consumer spending to stay at or near current levels.
The market is still oversupplied as carriers remain resilient despite financial challenges and right-sizing, limiting the market’s vulnerability to disruptions in the near term.
The surge of capacity that entered the market during the last inflationary rate cycle continues to be corrected as drivers exit and authority revocations continue.
The Bureau of Labor Statistics (BLS) reports that trucking employment has returned to pre-pandemic levels. Though this metric indicates declining supply, it does not capture owner-operator and small fleet capacity or private fleet growth, making it challenging to quantify exact supply levels based on this data alone.
Year-over-year tender rejection rate growth observed during seasonal and weather-related disruptions indicates increasing routing guide challenges and a more balanced supply environment. However, rates normalizing soon after disruptions subside confirms that capacity is still sufficient to support demand.
Private fleets continue to realize efficiencies and gain market share by increasing their tractor counts, prolonging the capacity surplus and limiting for-hire spot market demand.
This forecast outlines what we believe will be the most likely scenario based on the information available at the time of writing. The upside and downside risks presented could materialize due to unforeseen events, including but not limited to the following:
Ongoing confusion about tariffs, corporate tax cuts and other emerging U.S. policies affecting global trade and domestic economic activity has created uncertainty about the 2025 truckload demand environment. Any meaningful policies put into effect by the new administration or by foreign governments in response to those policies could lead to both upside and downside risks to the forecast.
Ongoing wars in Europe and the Middle East may continue to impact global trade. Similarly, tensions with China could affect Asia-U.S. relations and trade.
Although a recession seems unlikely in the near term, uncertainty remains. The effects of elevated inflation and interest rates are still emerging and could worsen trucking conditions faster than expected, as reduced consumer spending and manufacturing slowdowns may lead to declining demand.
Severe weather frequently disrupts the freight market. Hurricanes Helene and Milton last fall and winter storms in Q1 2025 all had notable short-term impacts on truckload markets. However, conditions rapidly normalizing after these events indicate that disruptions of this scale are unlikely to have a lasting market impact in the near term.
Public truckload carrier spot rates have remained below operating costs per mile for over two years. When this happens, spot rates usually rebound or experience upward pressure because they can only fall so far before carriers start losing money and exit the market. This scenario establishes a spot and contract rate floor like we’re seeing today. As capacity continues to leave the market, spot rates should reset higher after each period of seasonal volatility.
Fuel price and fuel surcharge volatility can complicate the measurement of forecast errors. These fluctuations can also alter shipper and carrier behavior. For example, rapidly declining fuel costs create more favorable conditions for carriers and ease pressure on shippers seeking cost reductions. Although fuel prices have been relatively stable recently, the past 2-3 years have redefined fuel price volatility.
The national average spot and contract rates per mile used in this report are sourced from DAT and undergo no additional processing by Arrive. However, DAT sometimes updates previously published rates, which can lead to variations between our report and materials created by DAT. Based on the macroeconomic factors impacting supply and demand in the domestic truckload freight market, we aim to set reasonable expectations for directional movements of the national average spot and contract rates published by DAT.