


The Morgan Stanley Dry Van Freight Index is another measure of relative supply; the higher the index, the tighter the market conditions. The black line with triangle markers on the chart provides a great view of what directional trends would be in line with normal seasonality based on historical data dating back to 2007.
The most recent reading in early July indicated trends are moving in line with the 10-year average, with some slight tightening in May that stabilized quickly. Based on historical trends, conditions will likely soften from late July to the end of August.
The reefer index remains close to the 10-year average. The flatbed index is slightly higher than in 2023 but is still well below the 10-year average.

Morgan Stanley Dry Van Truckload Freight Index
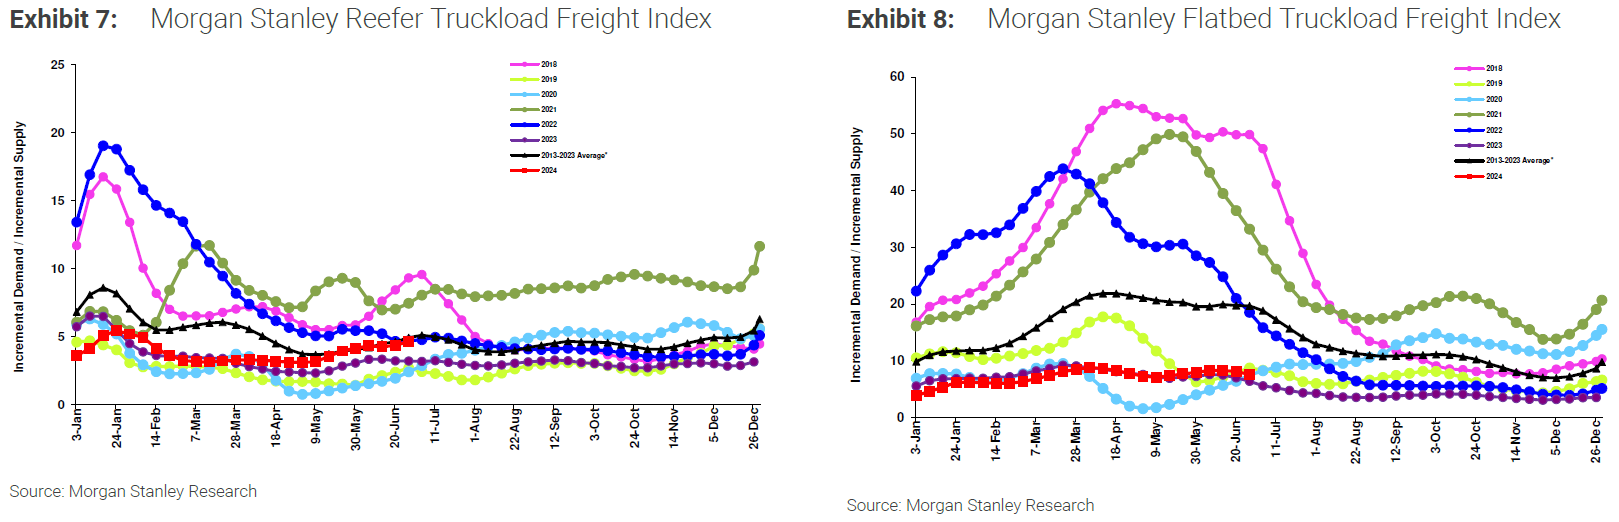 Morgan Stanley Reefer and Flatbed Truckload Freight Indices
The latest ACT Supply-Demand Index for May surged to 58.7, up from April’s 47.5, indicating a strong rebound driven by increased volumes and the ongoing capacity contraction. However, the sustainability of this trend remains uncertain as private fleets add capacity, influencing market dynamics beyond the index’s scope. Monitoring equipment purchasing trends will be crucial as market conditions evolve. Despite recent fluctuations, underlying cyclical improvements continue, supported by rising goods demand and recovering inventory cycles.
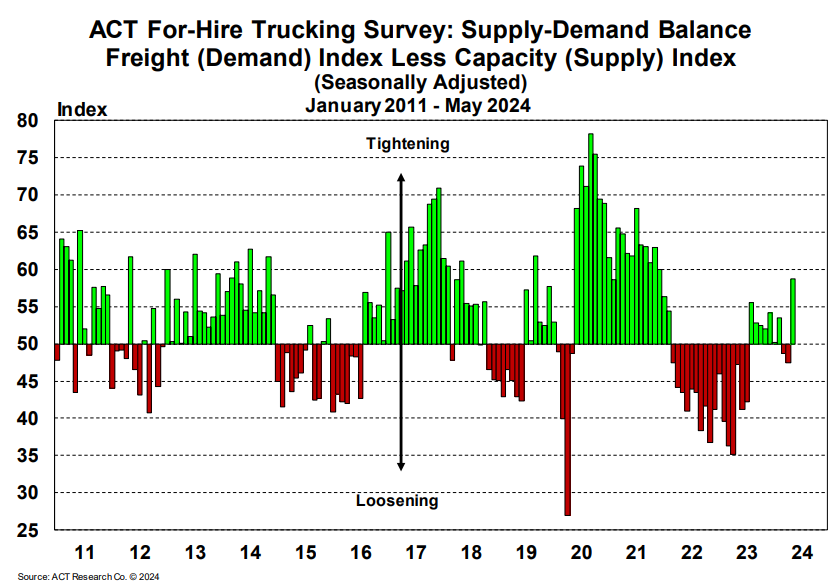 ACT For-Hire Trucking Survey
Though obtaining precise capacity data remains challenging, recent trends indicate supply is flattening despite declining demand. Capacity showed resilience amid early summer volatility and after Hurricane Beryl, confirming the market is in equilibrium territory.
The Sonar Outbound Tender Reject Index (OTRI), which measures the rate at which carriers reject the freight they are contractually required to take, shows more volatility now than at this time last year. So far, 2024 rejection rates have closely followed 2019 trends. If current conditions hold through year-end, tender rejection rates could rise meaningfully through the Q4 peak season. Rising rejection rates are likely the result of poor trucking conditions and carrier attrition over the past year.
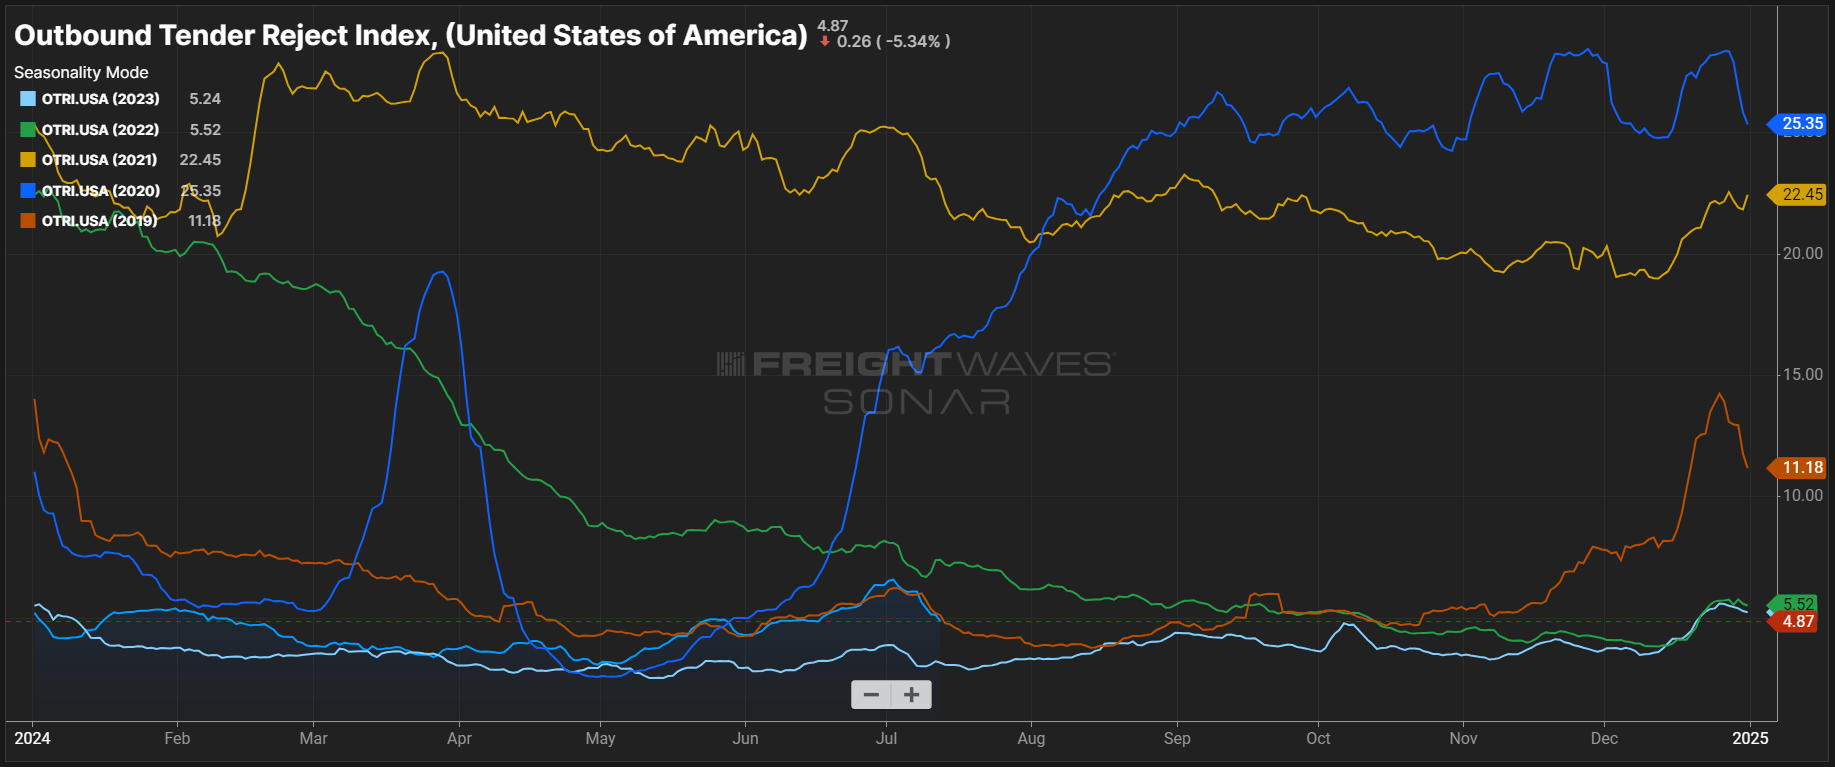 Outbound Tender Reject Index (SONAR)
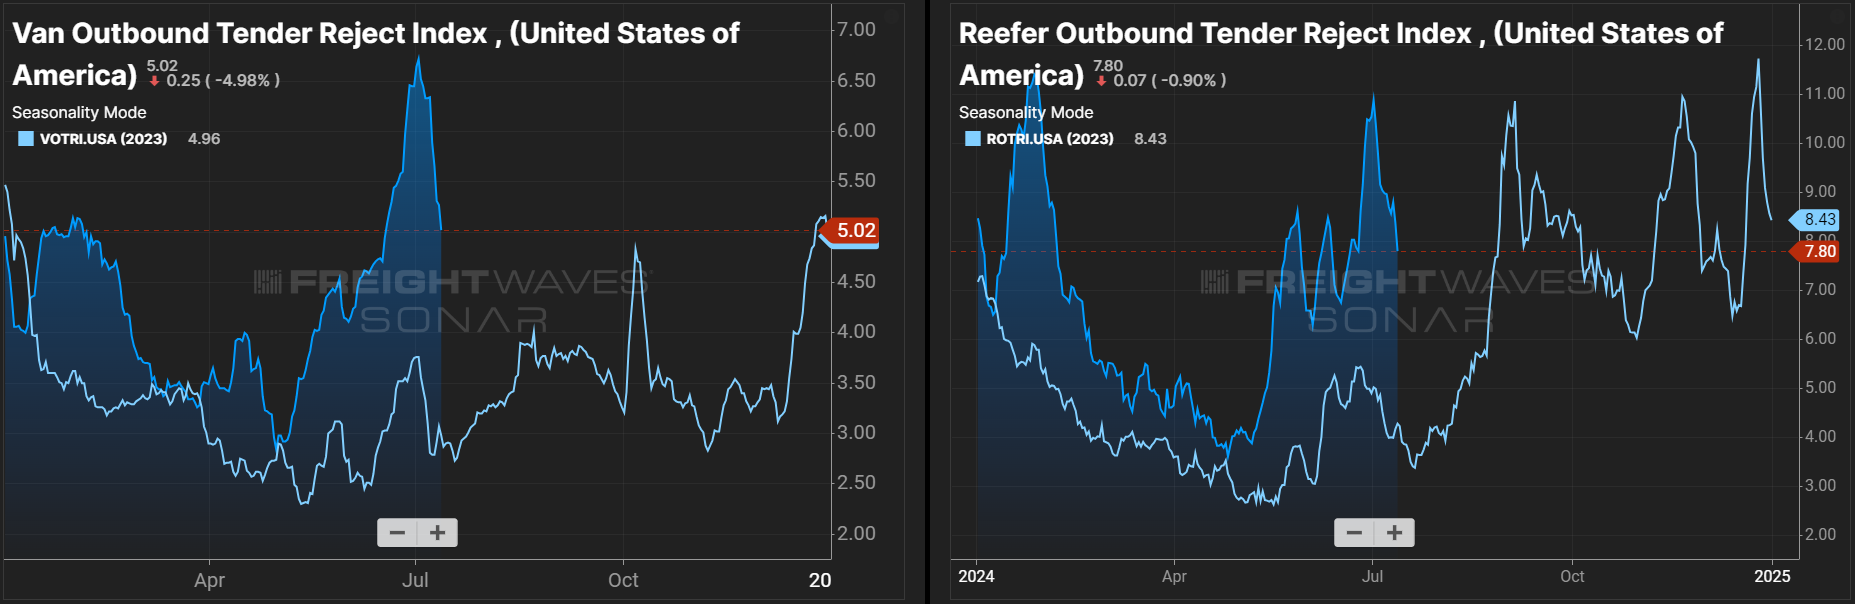 Van & Reefer Outbound Tender Reject Indices
The DAT Load-to-Truck Ratio measures the total number of loads relative to the total number of trucks posted on its spot board. The June reading rose to 4.72, marking the fourth consecutive monthly increase and the second-highest reading since February 2022 (January 2024 was the first). The reefer load-to-truck ratio also rose month-over-month to 7.03, slightly above this time last year and almost exactly in line with June 2022.
The capacity market continues to show resilience amid challenging conditions. Net revocations have slowed, and new market entrants have increased for the second consecutive quarter. This trend amid declining carrier exits has slowed the carrier attrition rate. Current conditions reflect the equilibrium market and may remain the same in the near term. According to FTR, the high number of new carrier entrants paired with settling levels of revocations could indicate that the weakest capacity has already left the market.
FTR’s Carrier Revocations, New Carriers & Net Change in Carrier Population
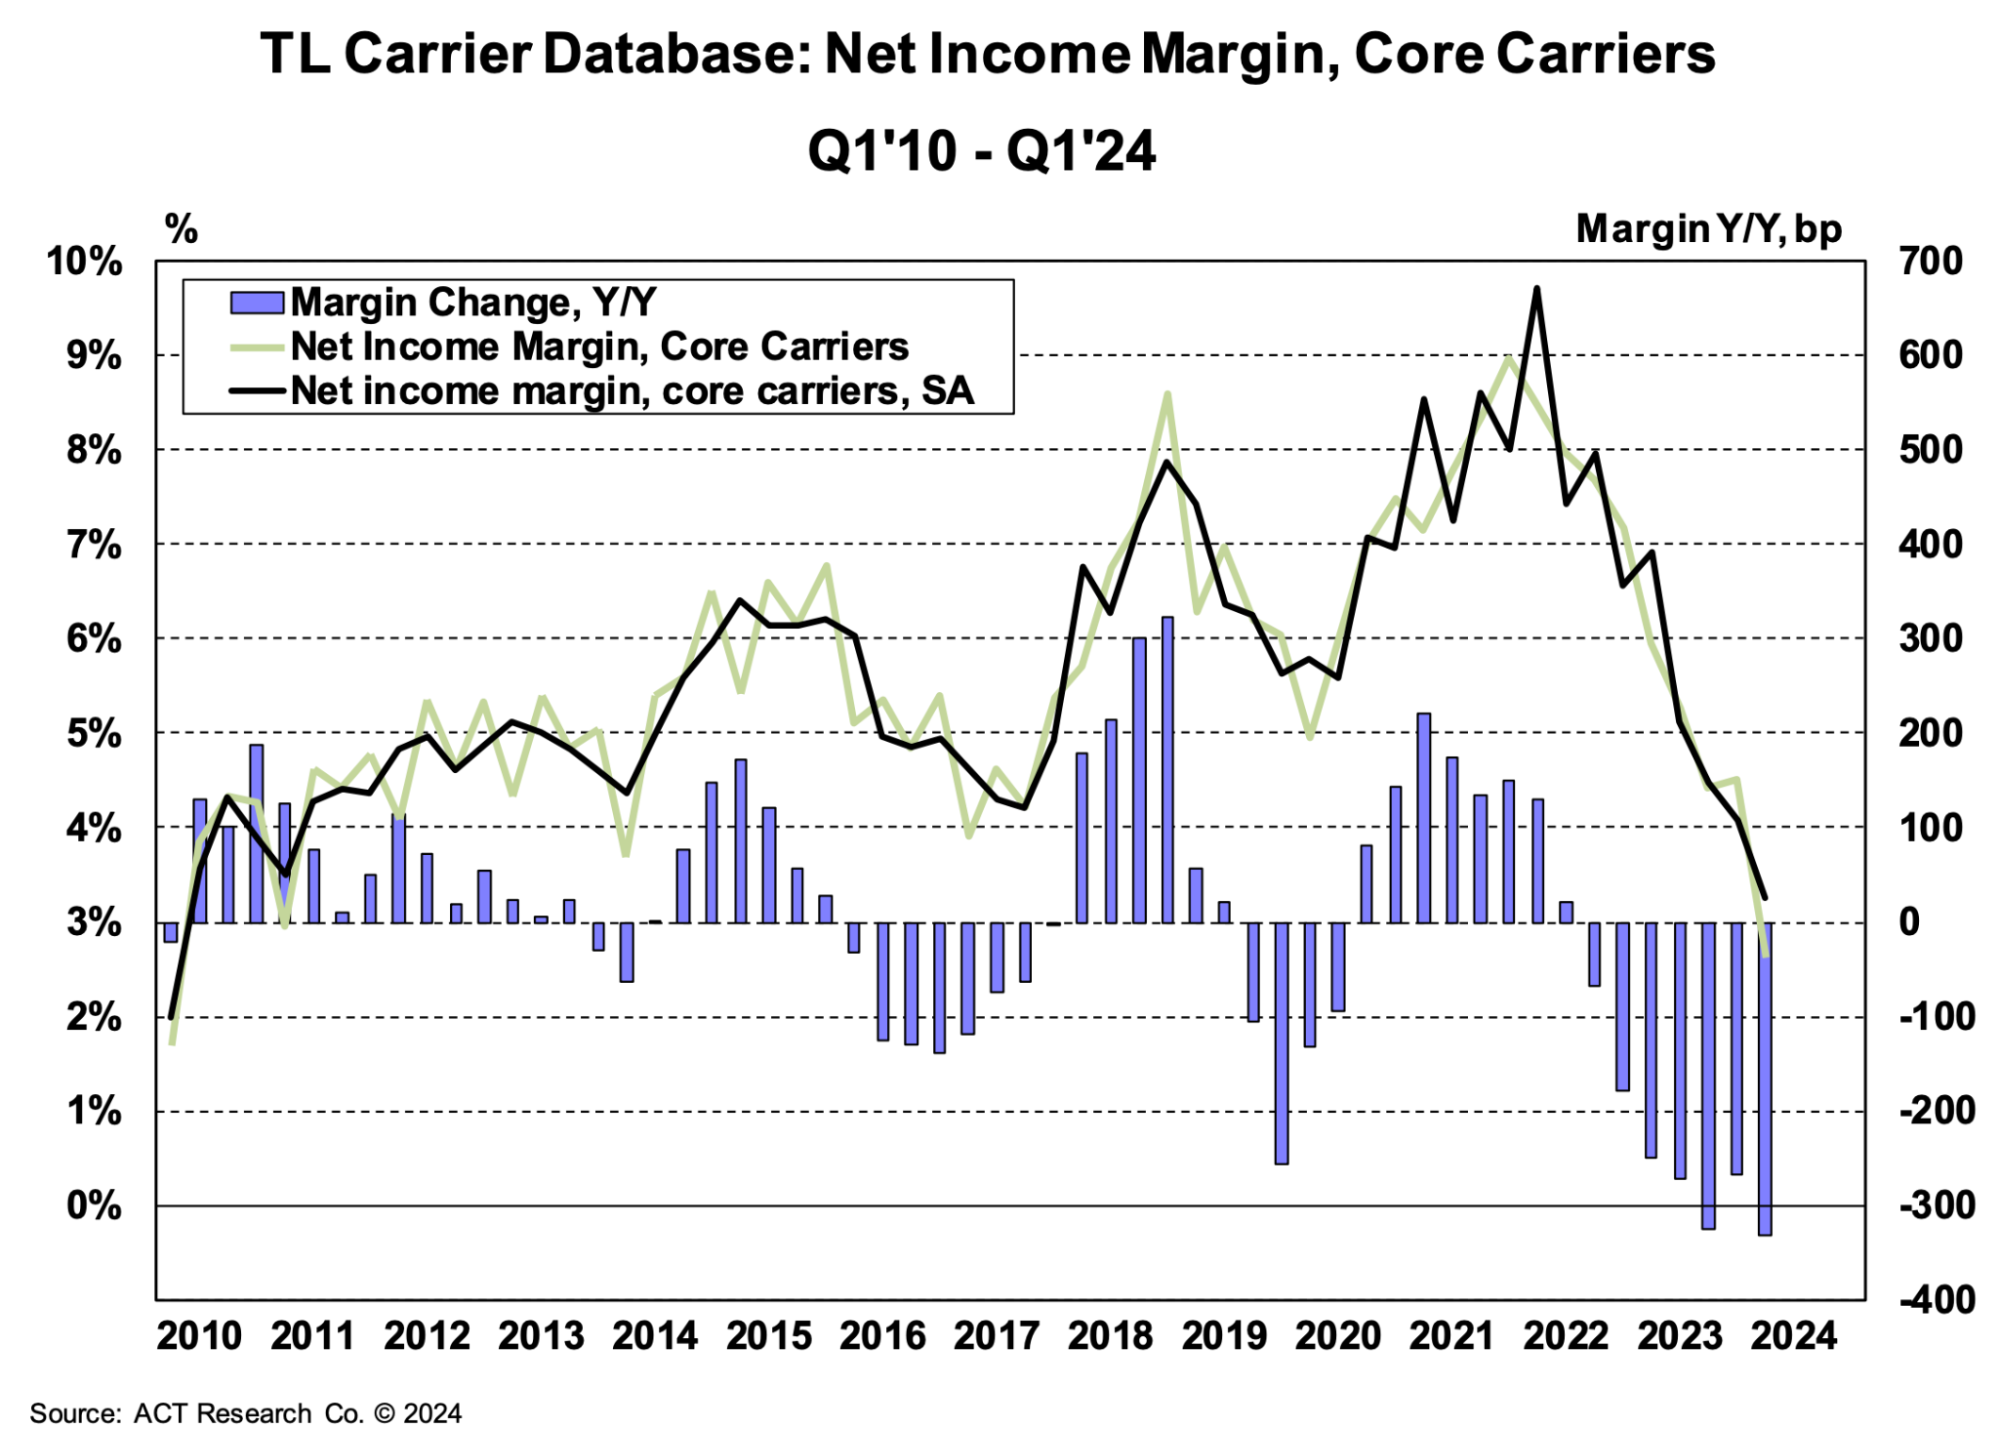
Carrier margins continued to shrink in Q1 amid declining revenues and high operating costs. Net income margins for ACT’s “core carriers” dropped to nearly 3% and had the largest year-over-year decline since at least 2010.
With spot market rates almost 25% lower than contract rates, carriers with heavy spot exposure are experiencing the greatest impact. Meanwhile, contract-driven fleets are still generating relatively strong revenues, and private fleets continue to increase capacity.
As challenging conditions drive more carriers out of the market, supply will shrink, and rates will rise, ultimately triggering inflationary conditions.
 ACT Research Core Carriers Net Income Margin
According to ACT Research, the preliminary Class 8 tractor backlog-to-build ratio decreased from 5.6 months in May to 5.0 months in June, reflecting updated build plans and net orders. The backlog itself decreased to approximately 77,000 units, the lowest in four years; this trend is unsurprising as rates and, in turn, carrier revenues remain down.
 ACT Research, U.S. Class 8 Tractors: Backlog and Backlog/Build Ratio
The ACT Driver Availability Index rose to 52.9 in May from 51.0 in April. This reading indicates strong driver availability, likely fueled by older drivers staying in the workforce due to increased living costs and a persistently challenging job market. Driver availability should remain healthy while the market is in equilibrium. However, as the job market tightens and wages rise, availability may decrease as older drivers retire and others pursue jobs in different industries. This shift is not anticipated to be a concern in 2024 but could have an impact in 2025.
 ACT For-Hire Trucking Index: Driver Availability
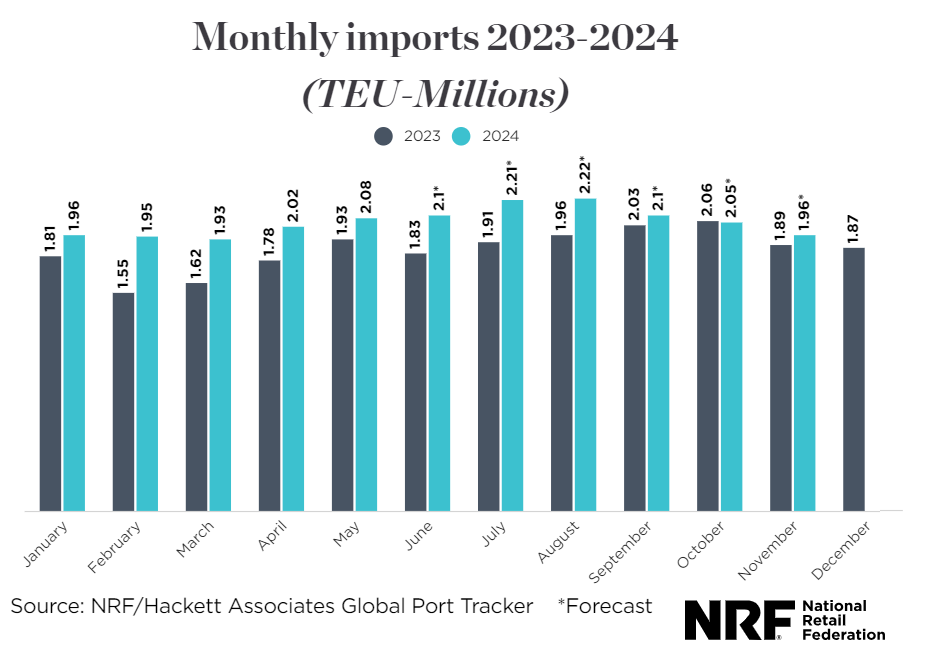
Overall, the demand outlook remains positive. The National Retail Federation’s (NRF) still expects over two million TEUs monthly until November. U.S. ports handled 2.08 million TEUs in May, an increase of 7.7% year-over-year and 3% month-over-month. The NRF’s forecast also calls for 4.43 million TEUs to move through U.S. ports in July and August, which would be an 18.4% year-over-year increase.
Increased imports indicate that retailers are restocking inventories in anticipation of strong holiday consumer demand. While this data is encouraging, we caution that retail orders are not always a true indicator of future retail spending. If retail executives overorder, it could create inventory stockpiles similar to those of the post-COVID era, which would have a deflationary impact on the freight market.
 NRF Monthly Imports
In June, DAT reported that spot load postings declined 9.4% month-over-month and 8.4% compared to June 2023. Such downward trends are normal for June. For example, in 2023, spot load postings declined by over 54% from June 2022. This year’s significant month-over-month decline likely resulted from spot load postings surging by 18% from April to May due to DOT Week and Memorial Day.
Spot truck postings declined sequentially, falling 9.4% from May and 26.9% from June 2023. This trend likely resulted from carriers posting fewer trucks and instead spending more time searching for loads.
Rates followed typical patterns in June and July, increasing around the Fourth of July and normalizing shortly after. Save for any major disruptions, rates will likely return to their floor as August approaches and then fluctuate on a seasonal basis. The large spot-contract rate gap means the market is less vulnerable to major disruptions, such as Hurricane Beryl.
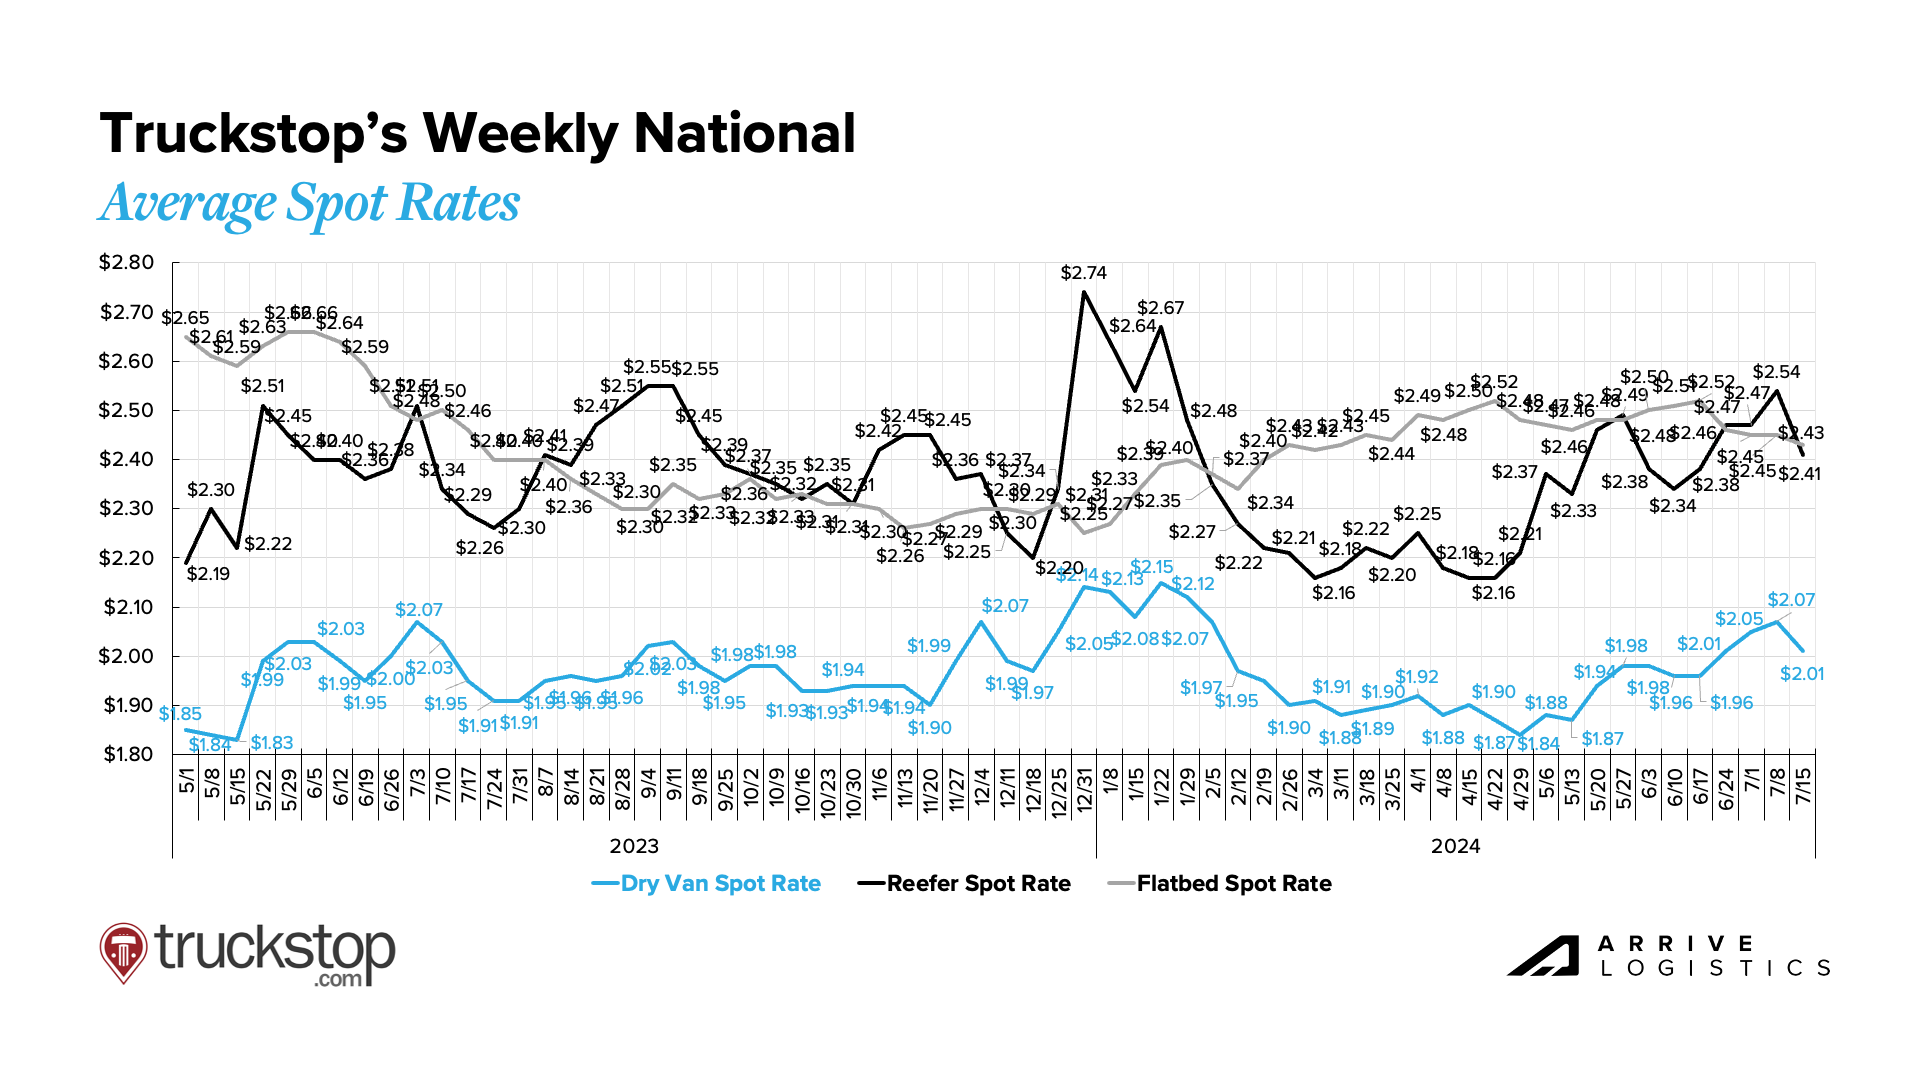 Truckstop Weekly National Spot Rate Average
National diesel prices ticked up in early June and have continued to increase week over week. Prices look very similar to this time last year, a cause for concern among carriers that endured high fuel costs throughout last summer. Much of the 2023 fuel cost surge resulted from OPEC’s surprise production cuts, but prices throughout this summer will likely remain elevated even without such a catalyst.
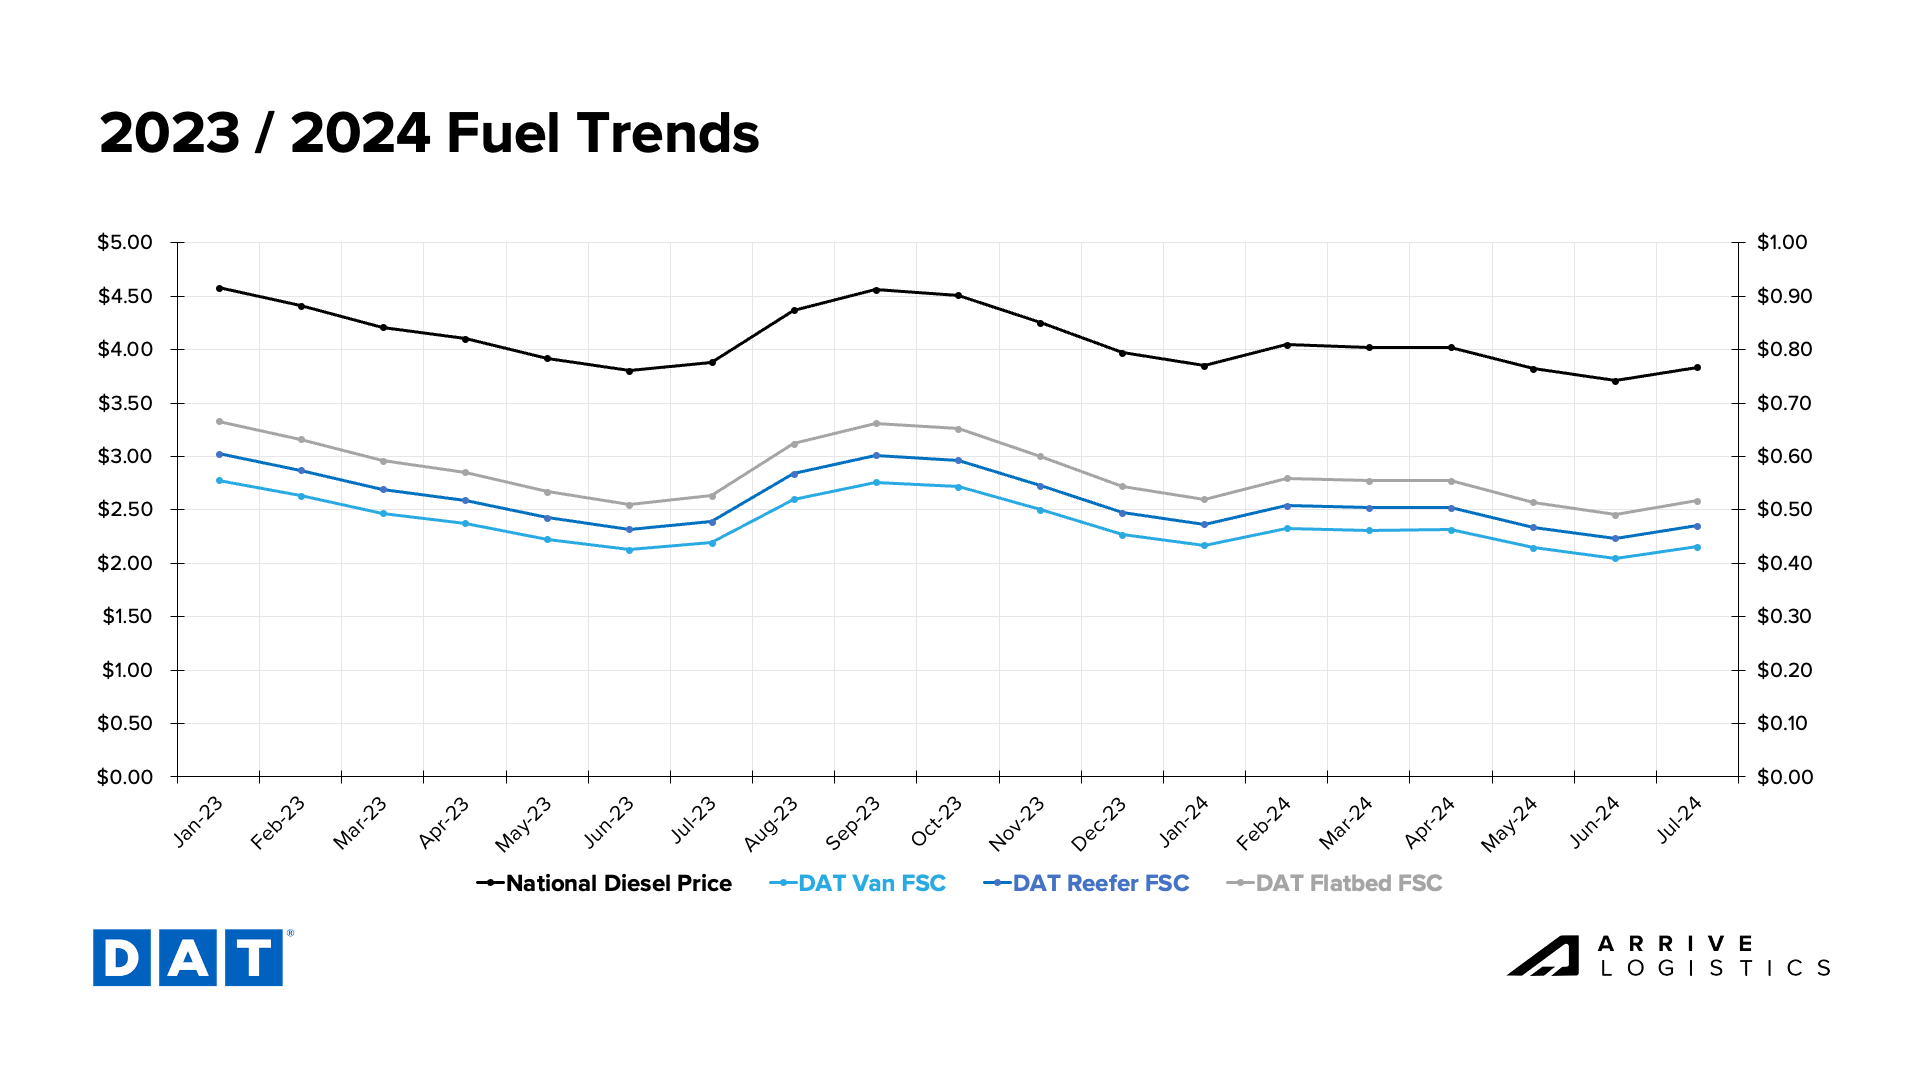 DAT Fuel Trends
DAT dry van linehaul rates continue to increase month-over-month, with mid-July averages of around $1.67 per mile. Contract rates remain steady, with mid-July averages at $2.02 per mile. This contract rate stability was unexpected and has led to a steady spot-contract spread, which, while consistent, remains historically elevated at $0.35 per mile. As a result, the market remains less vulnerable to demand disruptions despite increasing tender rejections.
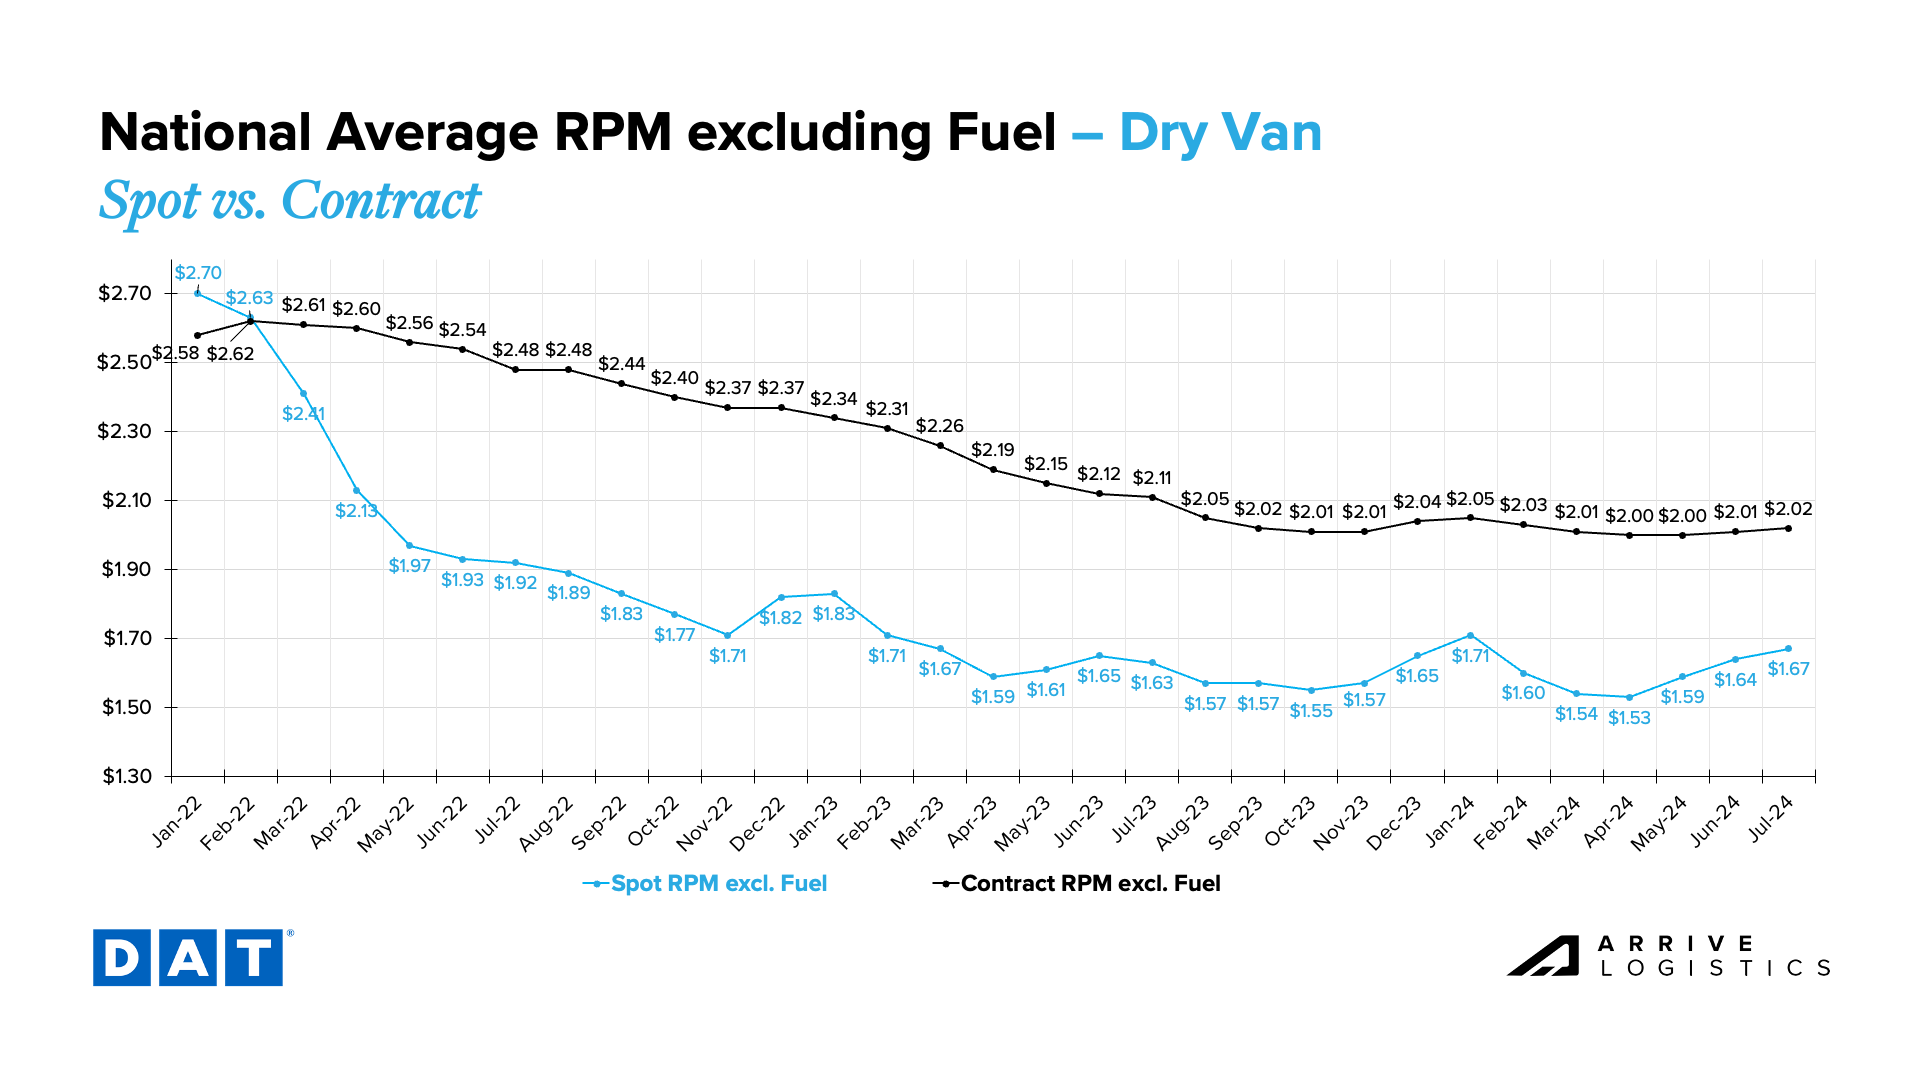 DAT Dry Van National Average RPM Spot vs. Contract
Recent volatility confirms that the temp controlled market recovery is further than dry van. Reefer linehaul rates approached $2.00 per mile in June and hit it in early July, marking the first time since January rates have reached this level. Contract rates have declined significantly in July but should soon normalize back to June levels.
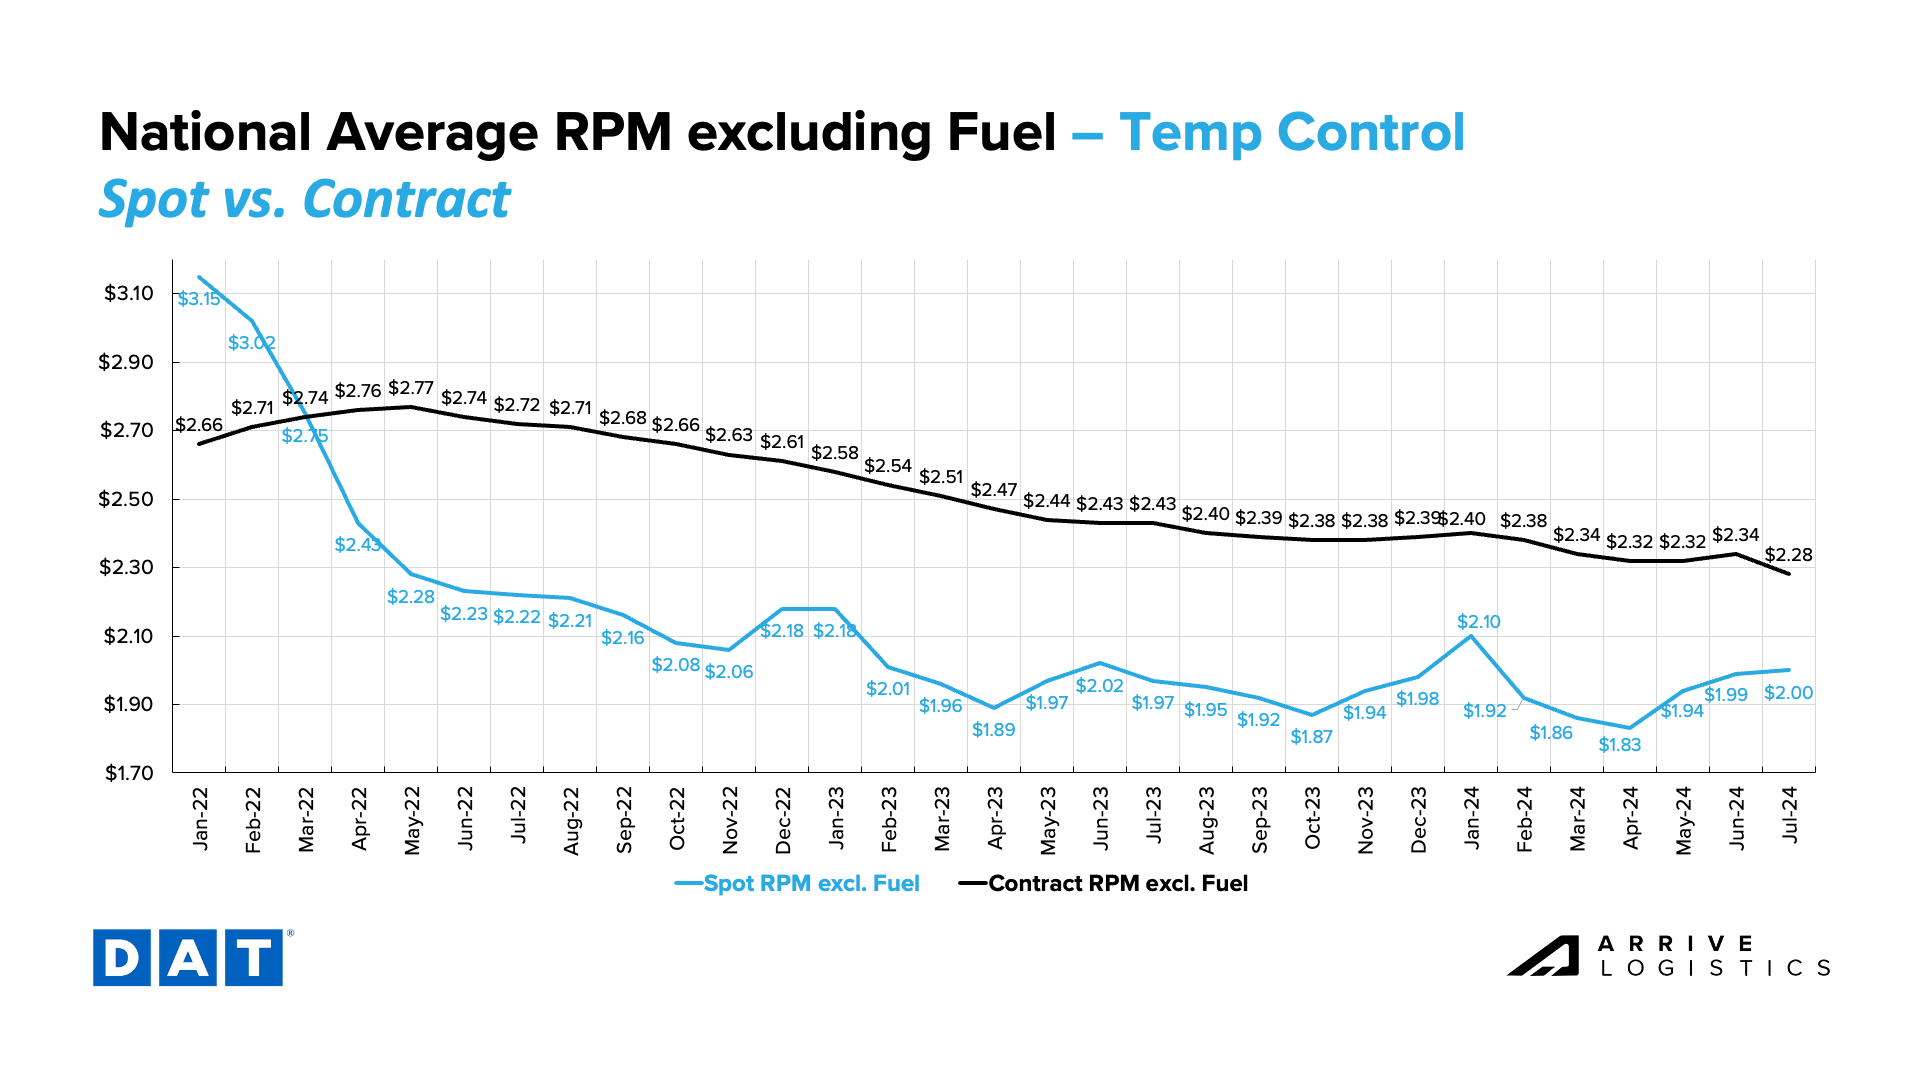 DAT Temp Control National Average RPM Spot vs. Contract
Flatbed spot rates remained steady at $2.01 per mile in early June, while contract rates continued to rise. If preliminary July numbers hold up, it would mark five consecutive months of contract rate increases. The flatbed spot-contract rate gap remains historically high at $0.63 per mile.
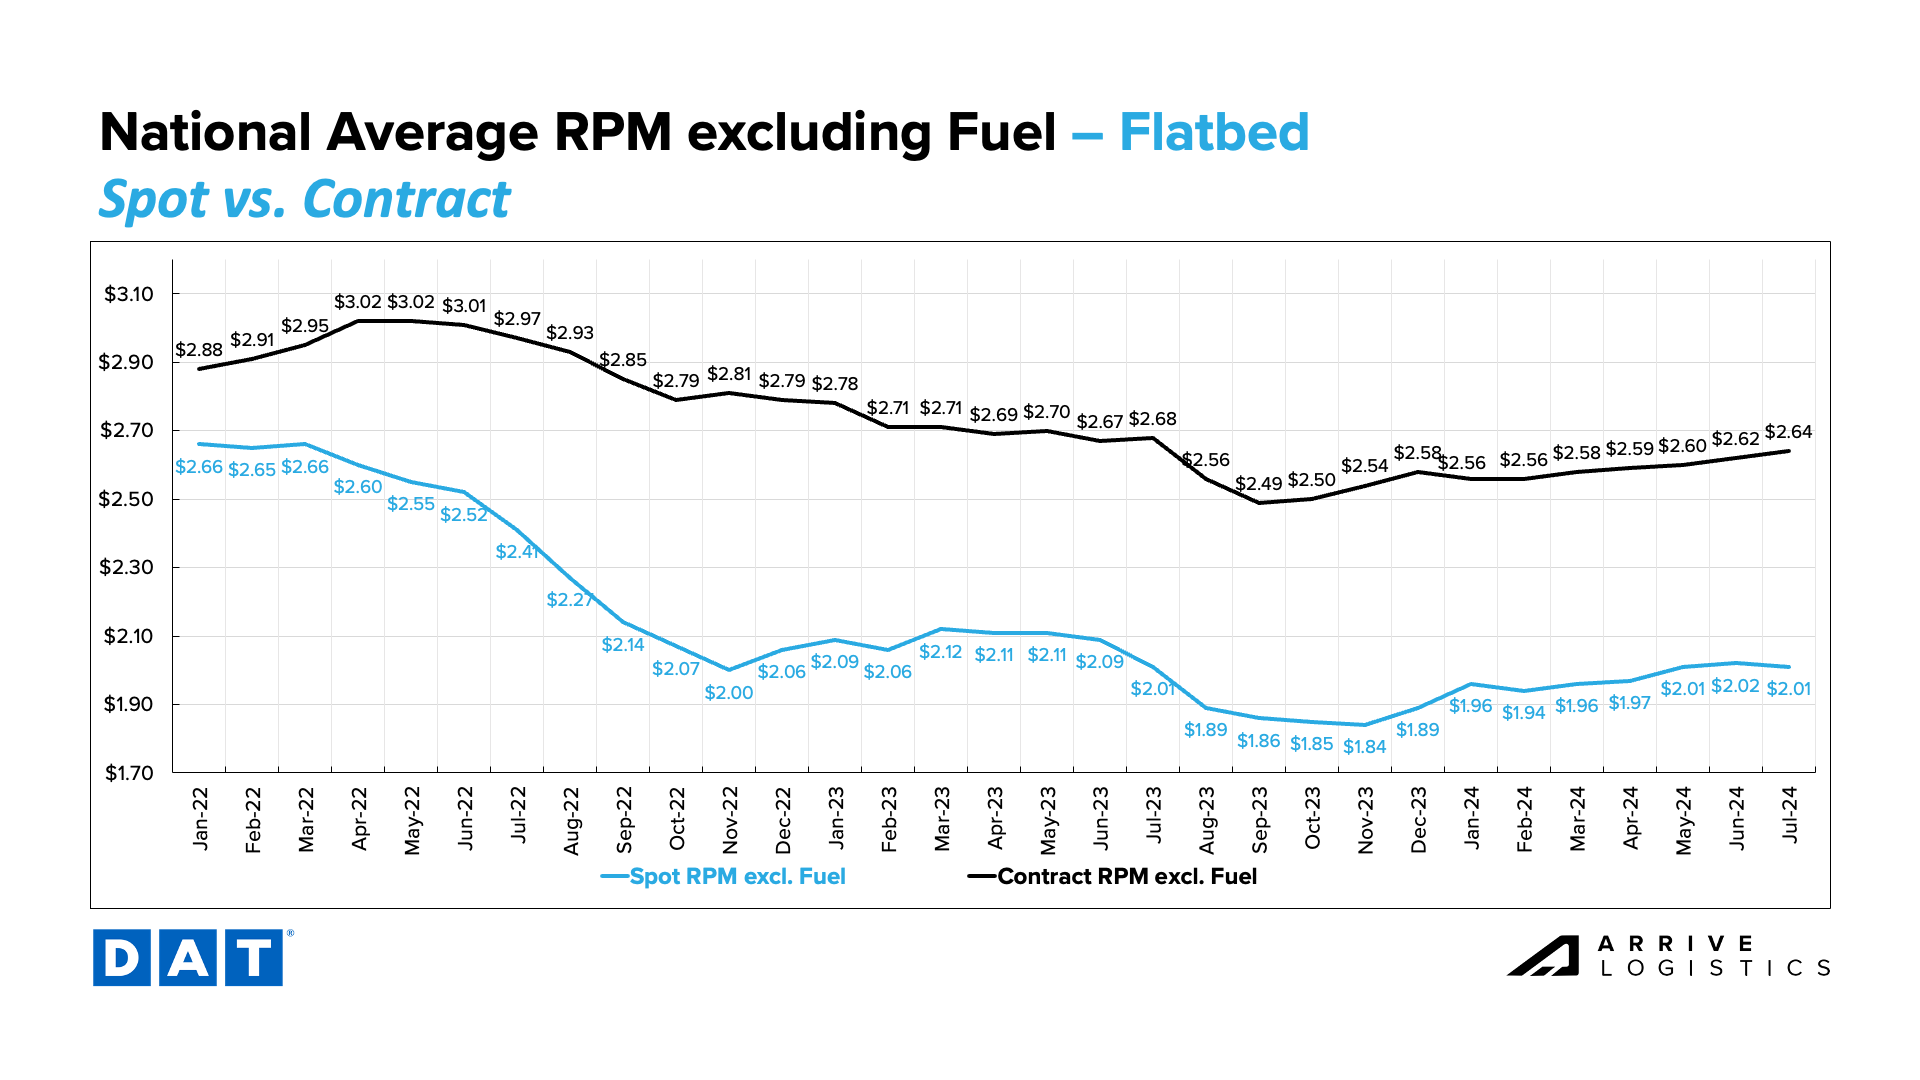 DAT Flatbed National Average RPM Spot vs. Contract
Inflation fell from 3.3% in May to 3.0% in June. While this is good news for customers, more than one rate cut this year is still unlikely, and the true impact of cooling inflation won’t take effect until 2025. Rate cuts would likely jump-start economic activity and spending as borrowing costs decline. However, because rate cuts may come with other less positive economic data that could offset any gains, we caution against making this a trend of focus.
Bank of America reports that credit and debit card spending decreased by 0.5% year-over-year in June. This was also the first month-over-month spending decline since January 2024. However, strong spending in April supported a 0.3% increase in Q2, indicating a positive trend overall. Services sector spending also increased in June, so a meaningful demand decline is unlikely in the near term.
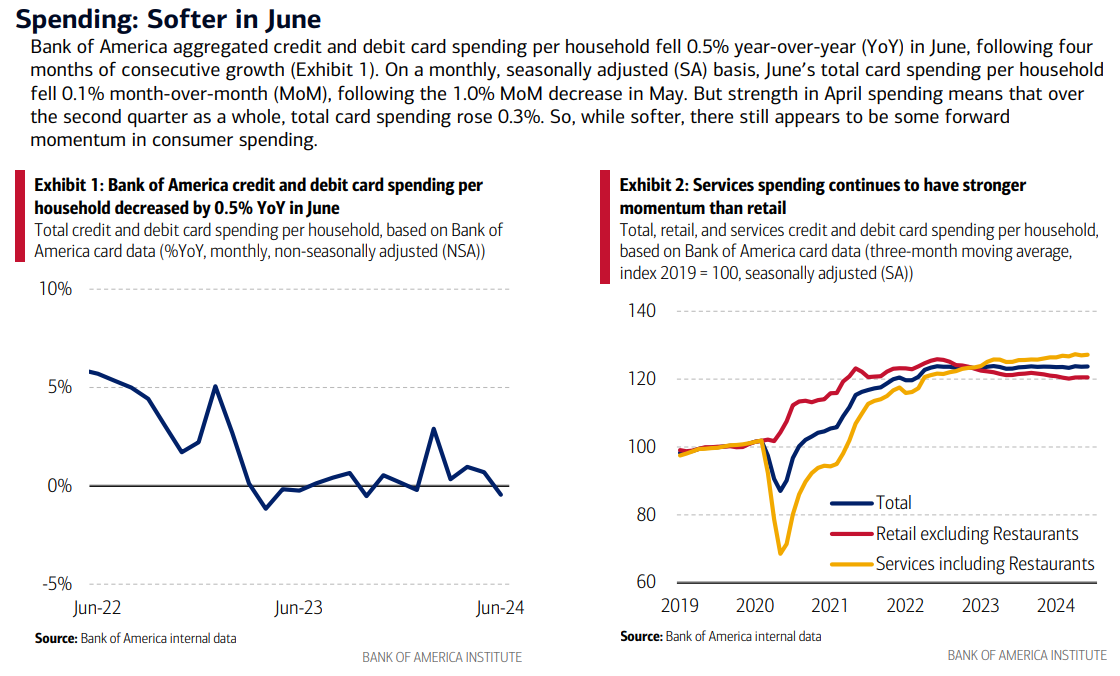 Bank of America, Total Card Spending per Household


