


The Sonar Contract Load Accepted Volume Index (CLAV) measures accepted load tenders moving under contracted agreements. It is similar to the Outbound Tender Volume Index (OTVI) but removes all rejected tenders.
In Q2 and early Q3, the CLAV index showed relatively strong contract volumes compared to historical levels. Overall, volumes were up nearly 8.6% month-over-month in early July, largely driven by dry van freight, which increased 8.1%. Reefer volumes regressed slightly, declining 0.9% month-over-month.
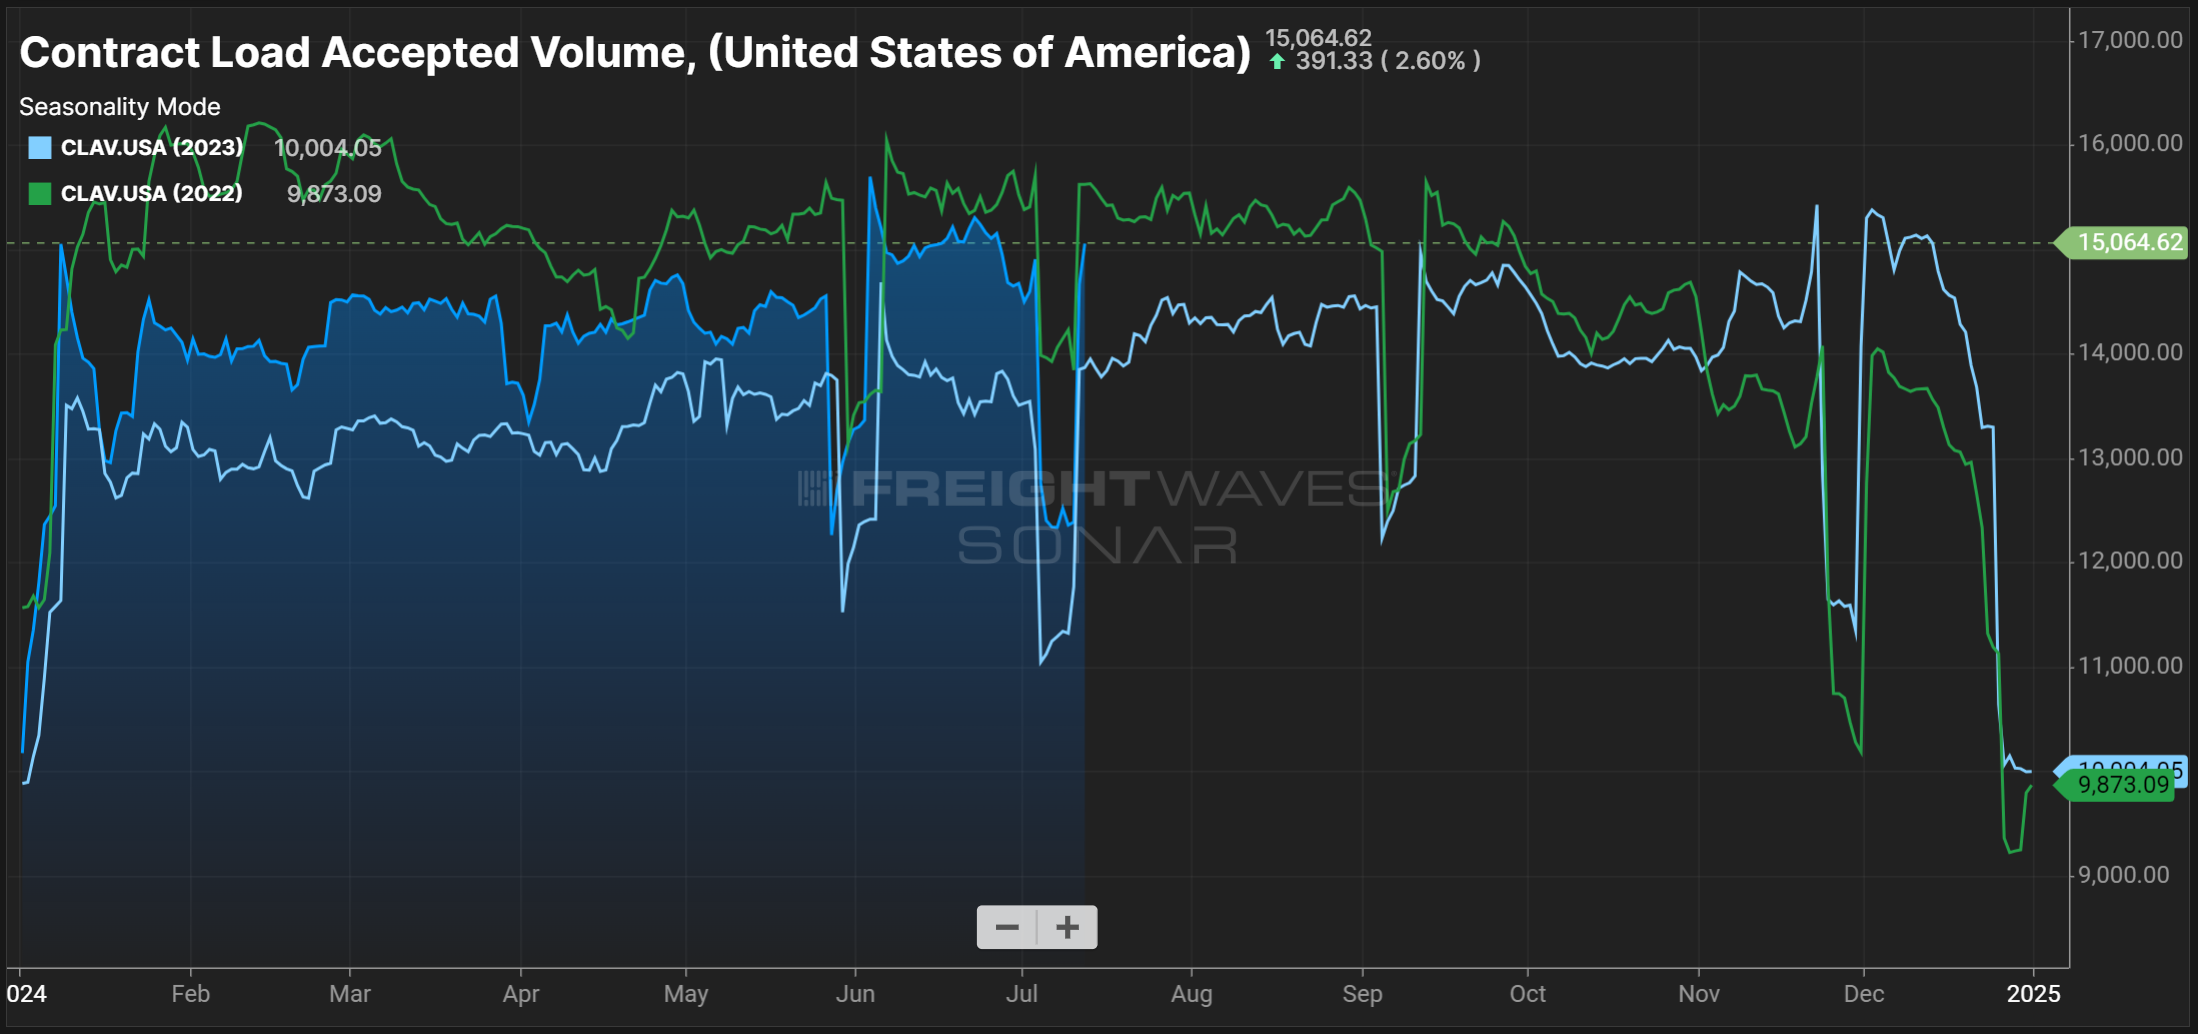 Contract Load Accepted Volume, SONAR
In June, DAT reported that spot load postings declined 9.4% month-over-month and 8.4% compared to June 2023. Such downward trends are normal for June. For example, in 2023, spot load postings declined by over 54% from June 2022. This year’s significant month-over-month decline likely resulted from spot load postings surging by 18% from April to May due to DOT Week and Memorial Day.
Spot truck postings declined sequentially, falling 9.4% from May and 26.9% from June 2023. This trend likely resulted from carriers posting fewer trucks and instead spending more time searching for loads.
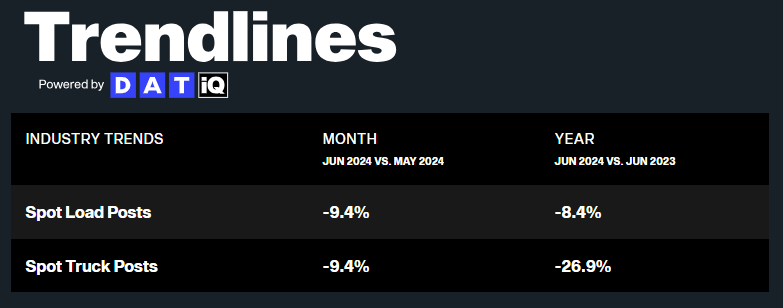 DAT Trendlines
The Cass Freight Index shipments component is a good indicator of overall market health because it encompasses both spot and contract freight based on bill data. The June reading declined nearly 2% from May, likely normalizing following a period of elevated shipments around DOT Week and Memorial Day.
Shipments were also down 6% year-over-year, creating even more challenges for carriers as supply and demand move toward balance. Ultimately, the numbers indicate that the market is firmly in equilibrium, with no imminent signs of an inflationary flip.
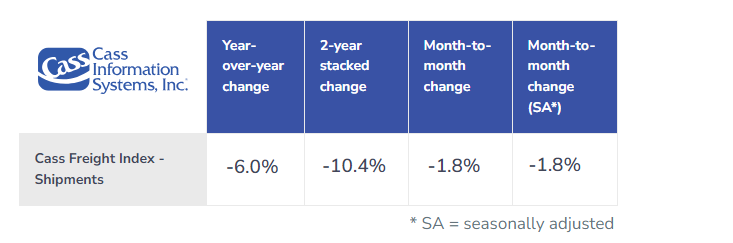 Cass Freight Index Report – June 2024
Though obtaining precise capacity data remains challenging, recent trends indicate supply is flattening despite declining demand. Capacity showed resilience amid early summer volatility and after Hurricane Beryl, confirming the market is in equilibrium territory.
The Sonar Outbound Tender Reject Index (OTRI), which measures the rate at which carriers reject the freight they are contractually required to take, shows more volatility now than at this time last year. So far, 2024 rejection rates have closely followed 2019 trends. If current conditions hold through year-end, tender rejection rates could rise meaningfully through the Q4 peak season. Rising rejection rates are likely the result of poor trucking conditions and carrier attrition over the past year.
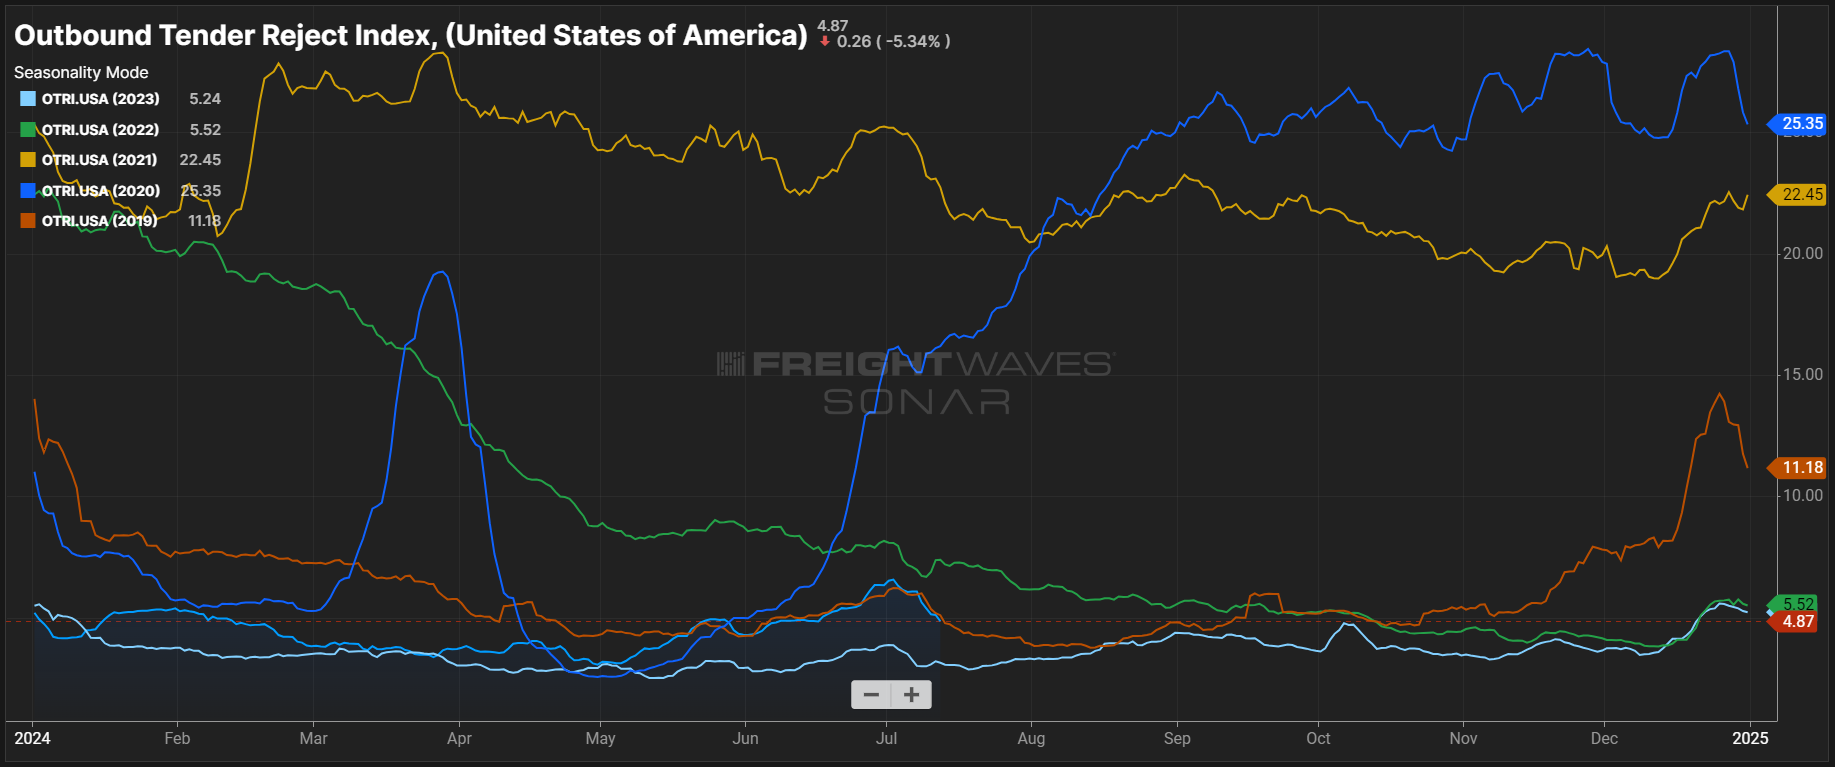 Outbound Tender Reject Index, SONAR: OTRI continue to move closely in line with 2019 levels, a year that saw limited disruption outside typical seasonal patterns.
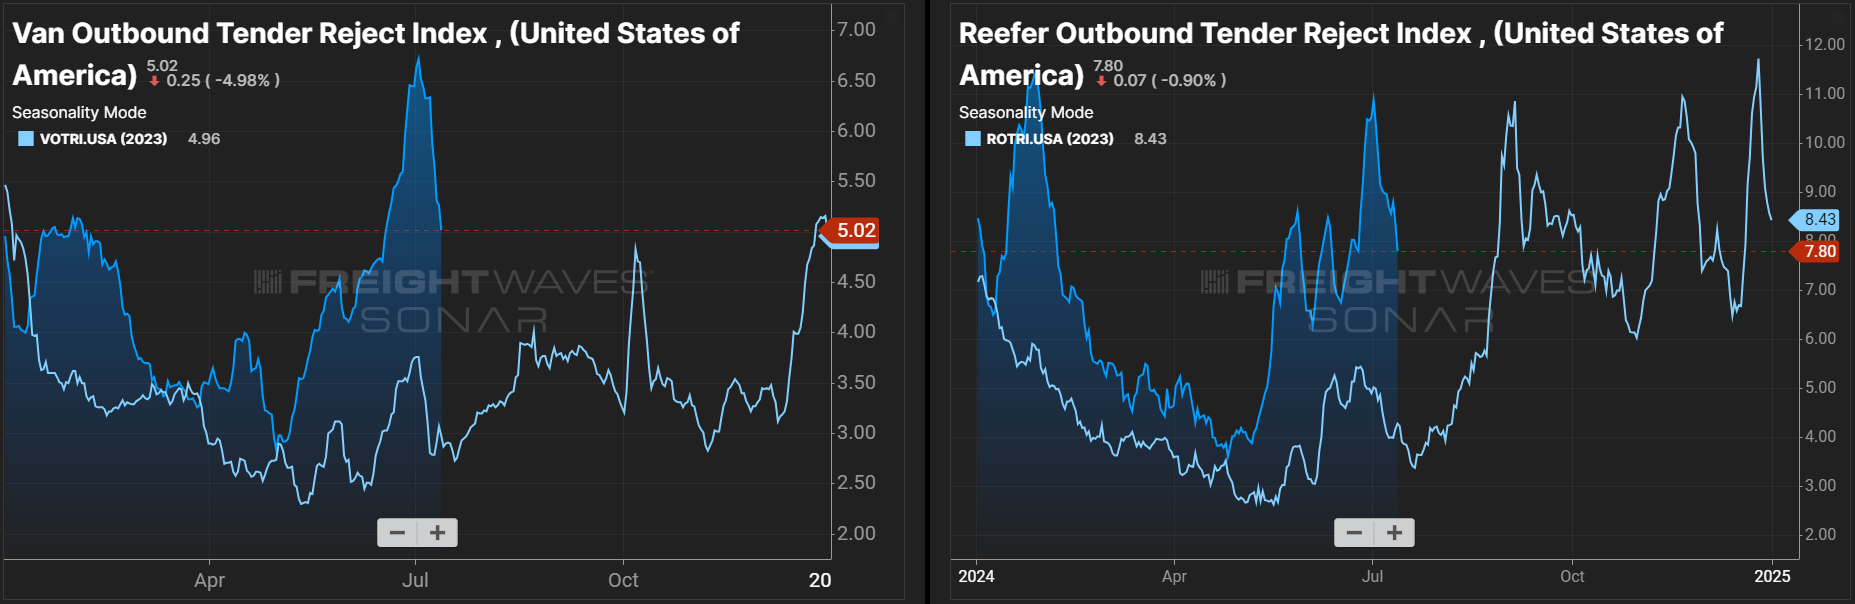 Dry Van and Reefer Outbound Tender Reject Indices, SONAR: Dry van and reefer tender rejections remain elevated year-over-year.
The DAT Load-to-Truck Ratio measures the total number of loads relative to the total number of trucks posted on its spot board. The June reading rose to 4.72, marking the fourth consecutive monthly increase and the second-highest reading since February 2022 (January 2024 was the first). The reefer load-to-truck ratio also rose month-over-month to 7.03, slightly above this time last year and almost exactly in line with June 2022.
 DAT Reefer Load-To-Truck Ratio
The Morgan Stanley Dry Van Freight Index is another measure of relative supply; the higher the index, the tighter the market conditions. The black line with triangle markers on the chart provides a great view of what directional trends would be in line with normal seasonality based on historical data dating back to 2007.
The most recent reading in early July indicated trends are moving in line with the 10-year average, with some slight tightening in May that stabilized quickly. Based on historical trends, conditions will likely soften from late July to the end of August.
The reefer index remains close to the 10-year average. The flatbed index is slightly higher than in 2023 but is still well below the 10-year average.

Morgan Stanley Dry Van Truckload Freight Index
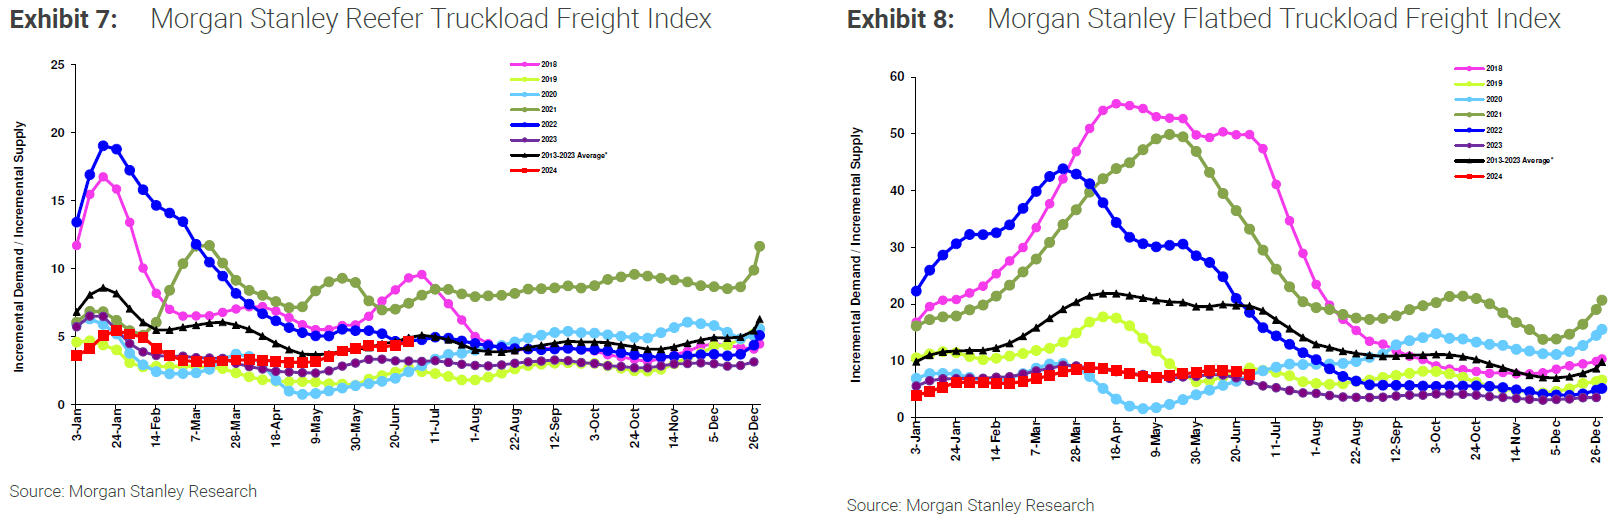 Morgan Stanley Reefer and Flatbed Truckload Freight Indices
Rates followed typical patterns in June and July, increasing around the Fourth of July and normalizing shortly after. Save for any major disruptions, rates will likely return to their floor as August approaches and then fluctuate on a seasonal basis. The large spot-contract rate gap means the market is less vulnerable to major disruptions, such as Hurricane Beryl.
 Truckstop’s Weekly National Average Spot Rates
According to DAT, all-in spot rates across the three major modes have increased month-over-month in July. Dry van leads the way, with rates rising by $0.05 to $2.10 per mile. As the end of the month draws near, rates should fall closer to June averages.
All-in reefer and flatbed rates also increased but to a lesser degree than van. Ultimately, linehaul rates will likely normalize, but elevated summer fuel costs could lead all-in rates to flatline.
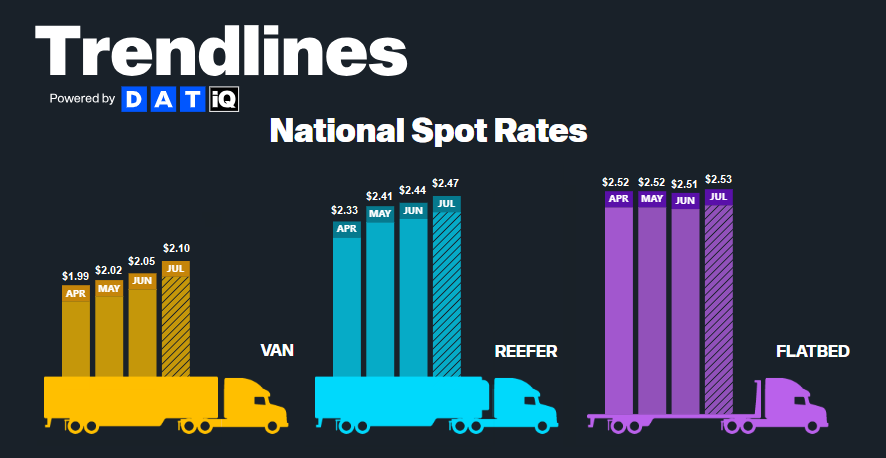 DAT Monthly Rate Trends
National diesel prices ticked up in early June and have continued to increase week over week. Prices look very similar to this time last year, a cause for concern among carriers that endured high fuel costs throughout last summer. Much of the 2023 fuel cost surge resulted from OPEC’s surprise production cuts, but prices throughout this summer will likely remain elevated even without such a catalyst.
DAT dry van linehaul rates continue to increase month-over-month, with mid-July averages of around $1.67 per mile. Contract rates remain steady, with mid-July averages at $2.02 per mile. This contract rate stability was unexpected and has led to a steady spot-contract spread, which, while consistent, remains historically elevated at $0.35 per mile. As a result, the market remains less vulnerable to demand disruptions despite increasing tender rejections.
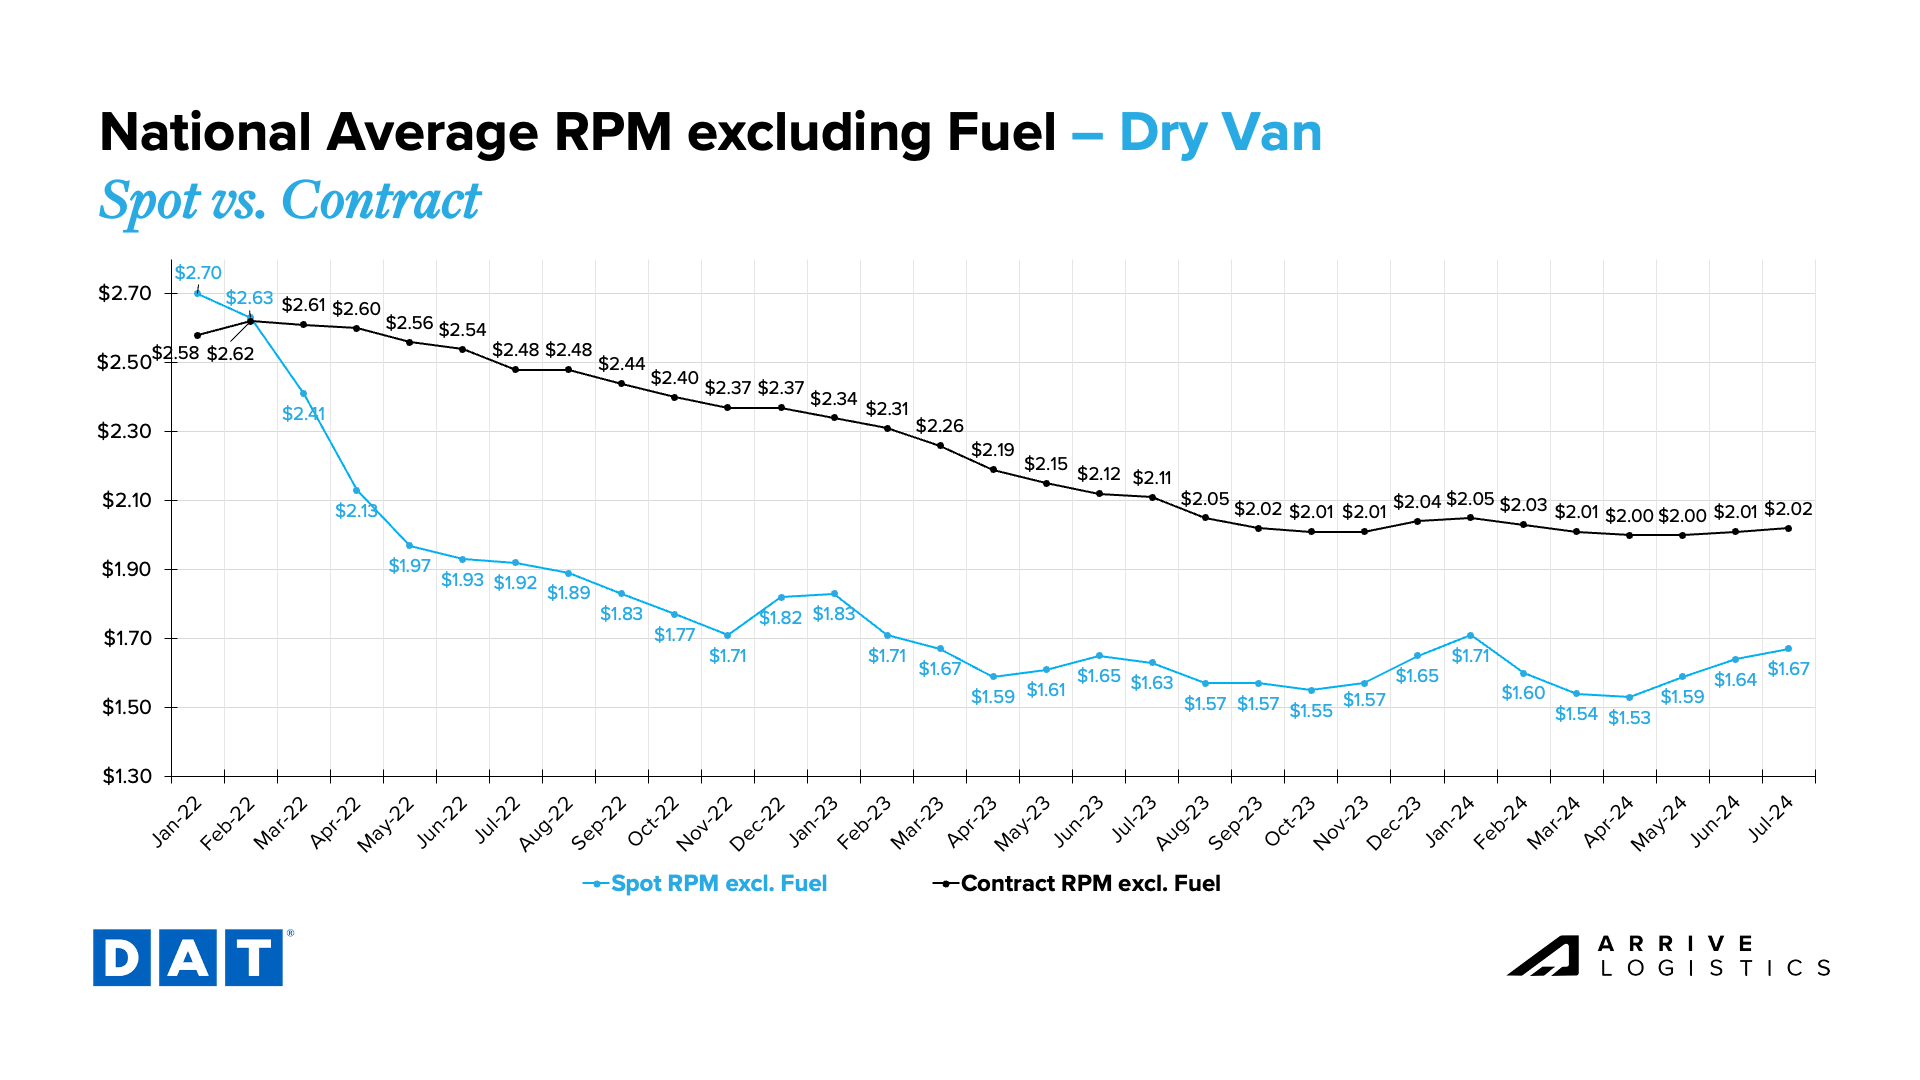 DAT Dry Van National Average RPM Spot vs. Contract
Recent volatility confirms that the temp controlled market recovery is further than dry van. Reefer linehaul rates approached $2.00 per mile in June and hit it in early July, marking the first time since January rates have reached this level. Contract rates have declined significantly in July but should soon normalize back to June levels.
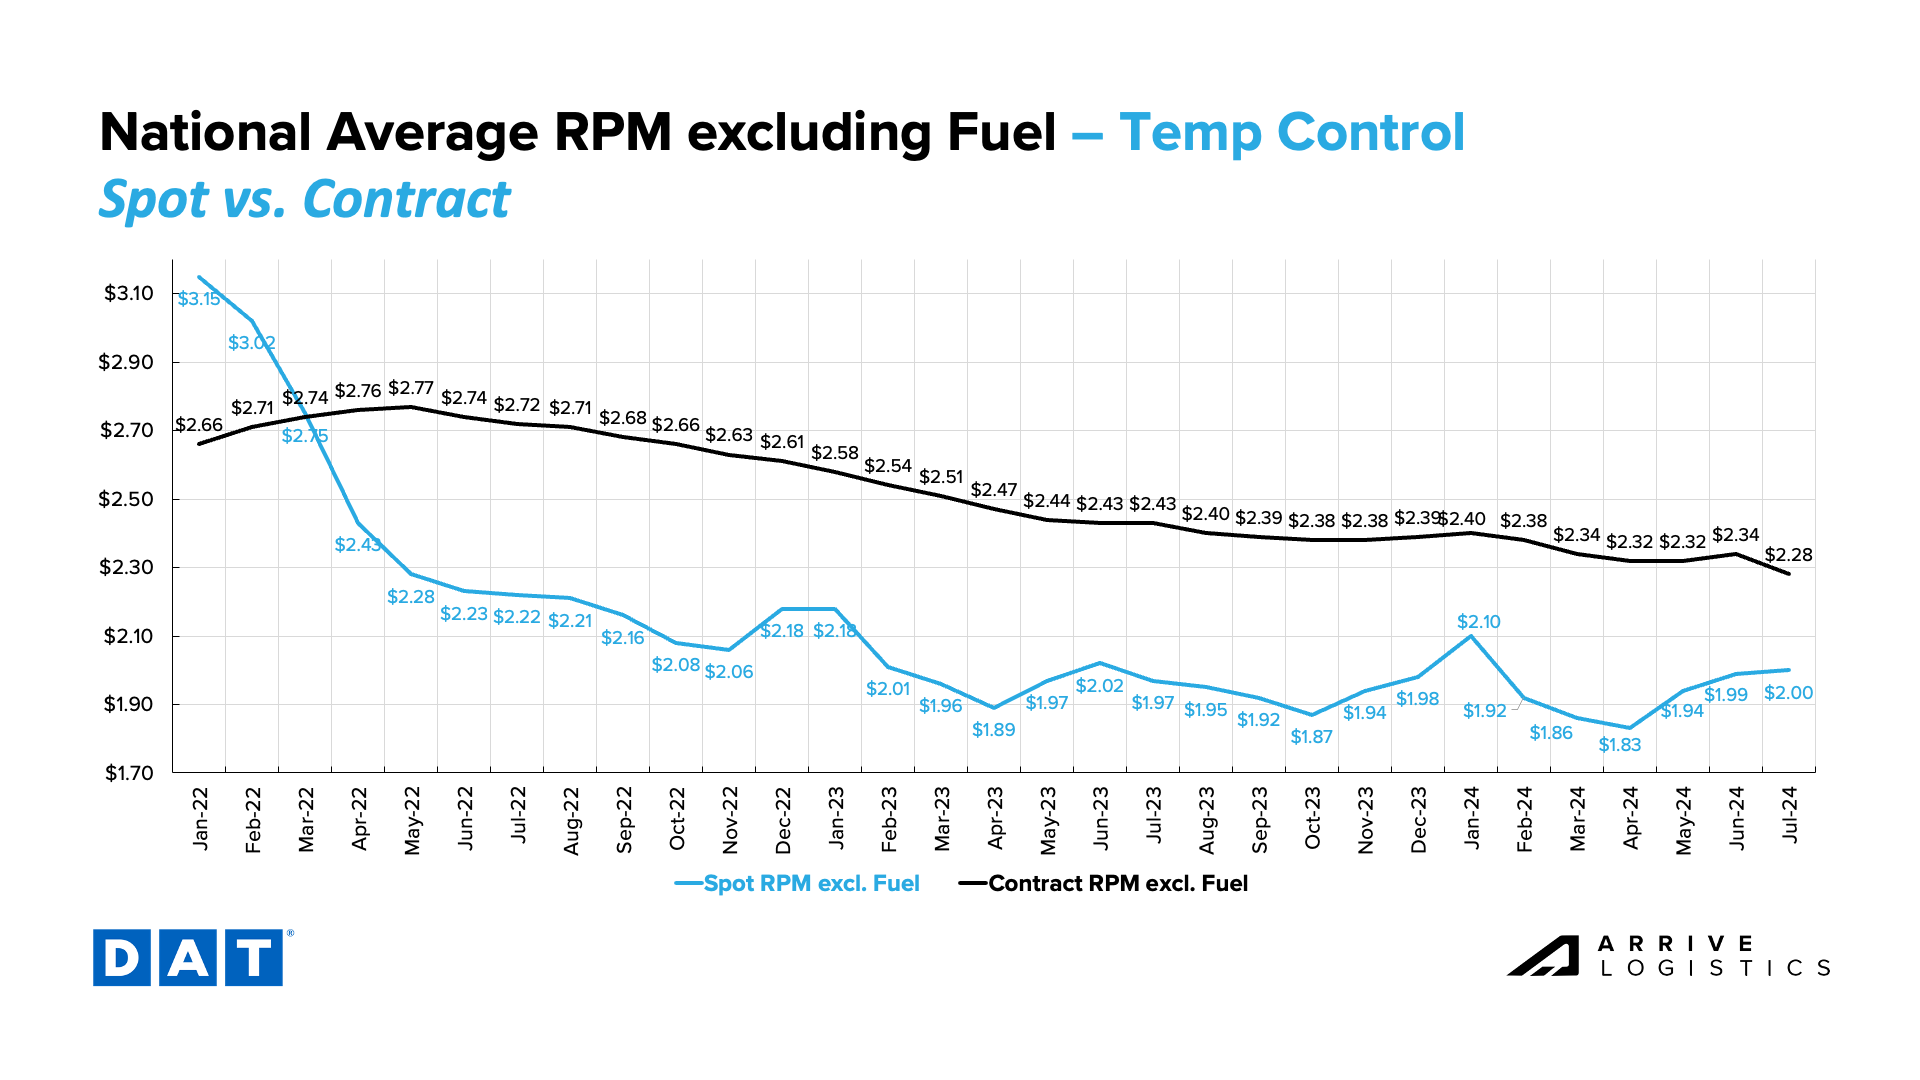 DAT Temp Control National Average RPM Spot vs. Contract
Flatbed spot rates remained steady at $2.01 per mile in early June, while contract rates continued to rise. If preliminary July numbers hold up, it would mark five consecutive months of contract rate increases. The flatbed spot-contract rate gap remains historically high at $0.63 per mile.
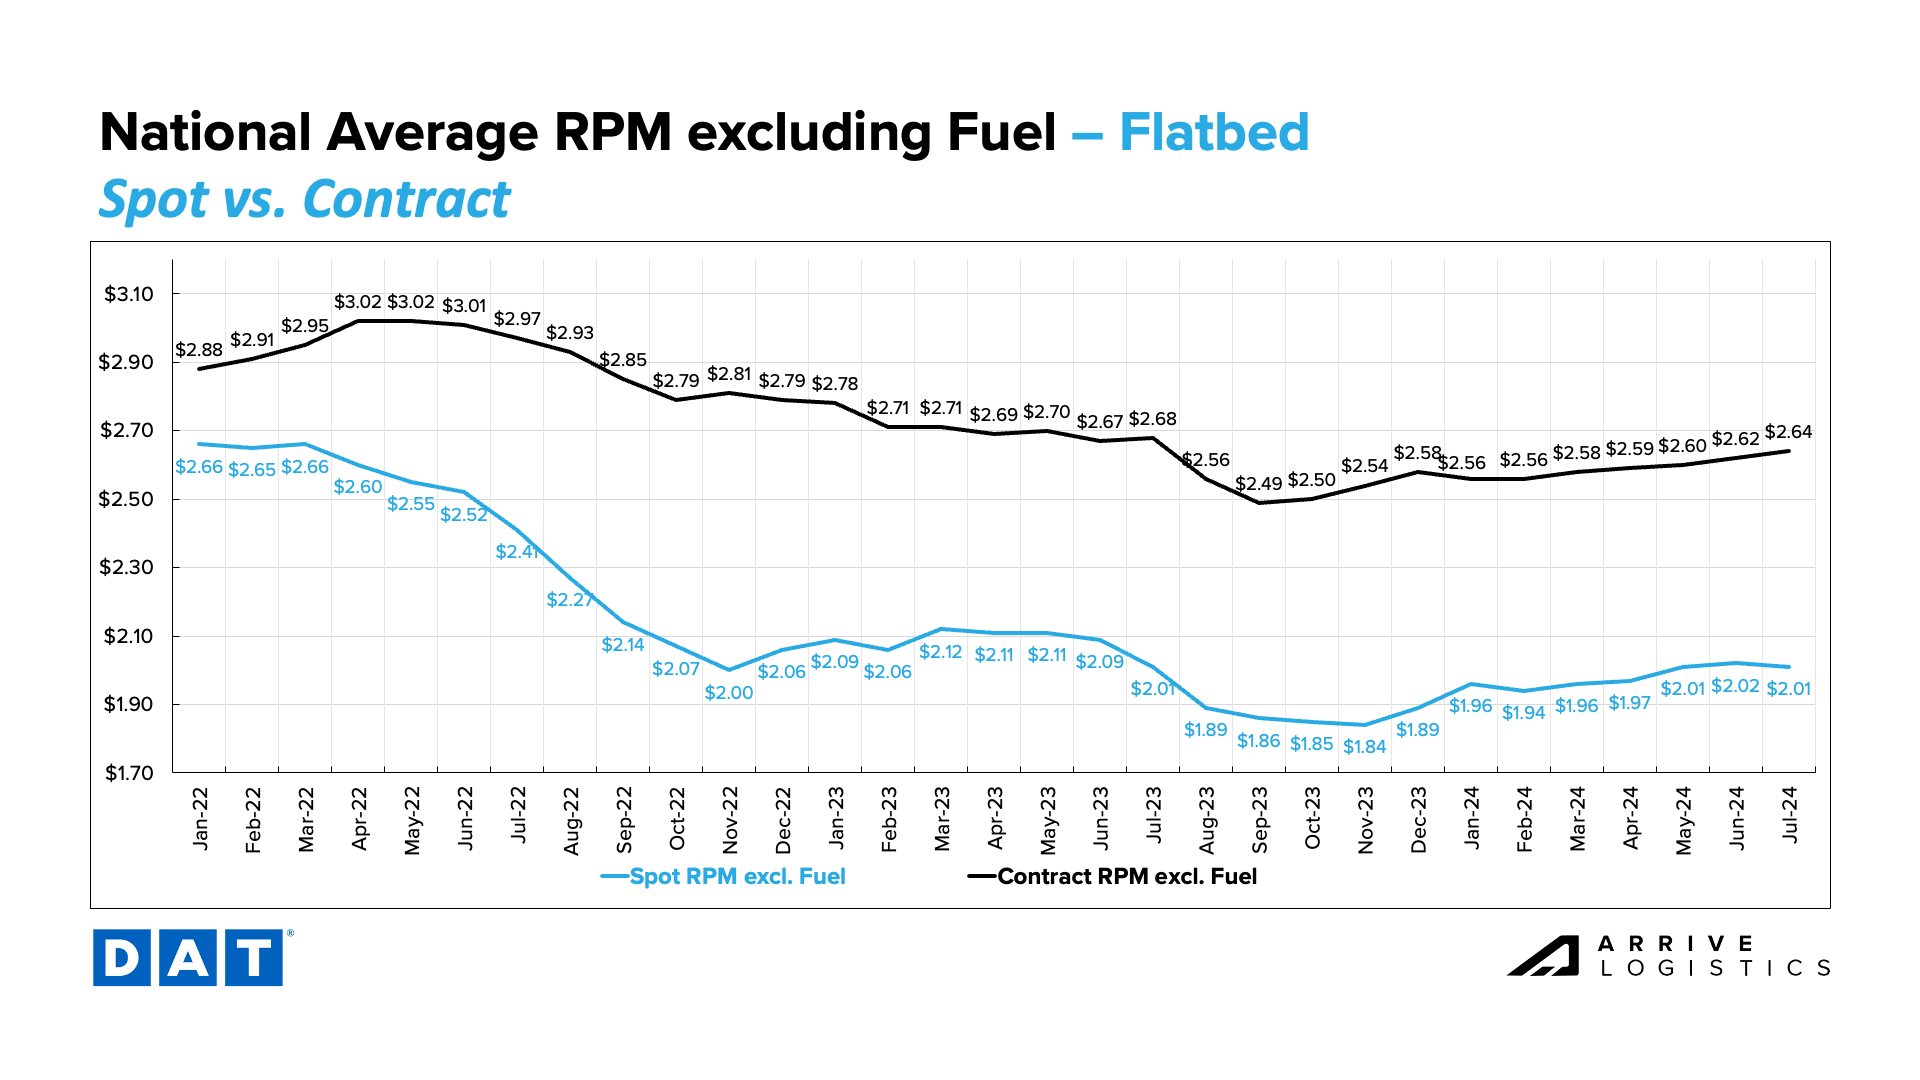 DAT Flatbed National Average RPM Spot vs. Contract
The capacity market continues to show resilience amid challenging conditions. Net revocations have slowed, and new market entrants have increased for the second consecutive quarter. This trend amid declining carrier exits has slowed the carrier attrition rate. Current conditions reflect the equilibrium market and may remain the same in the near term. According to FTR, the high number of new carrier entrants paired with settling levels of revocations could indicate that the weakest capacity has already left the market.
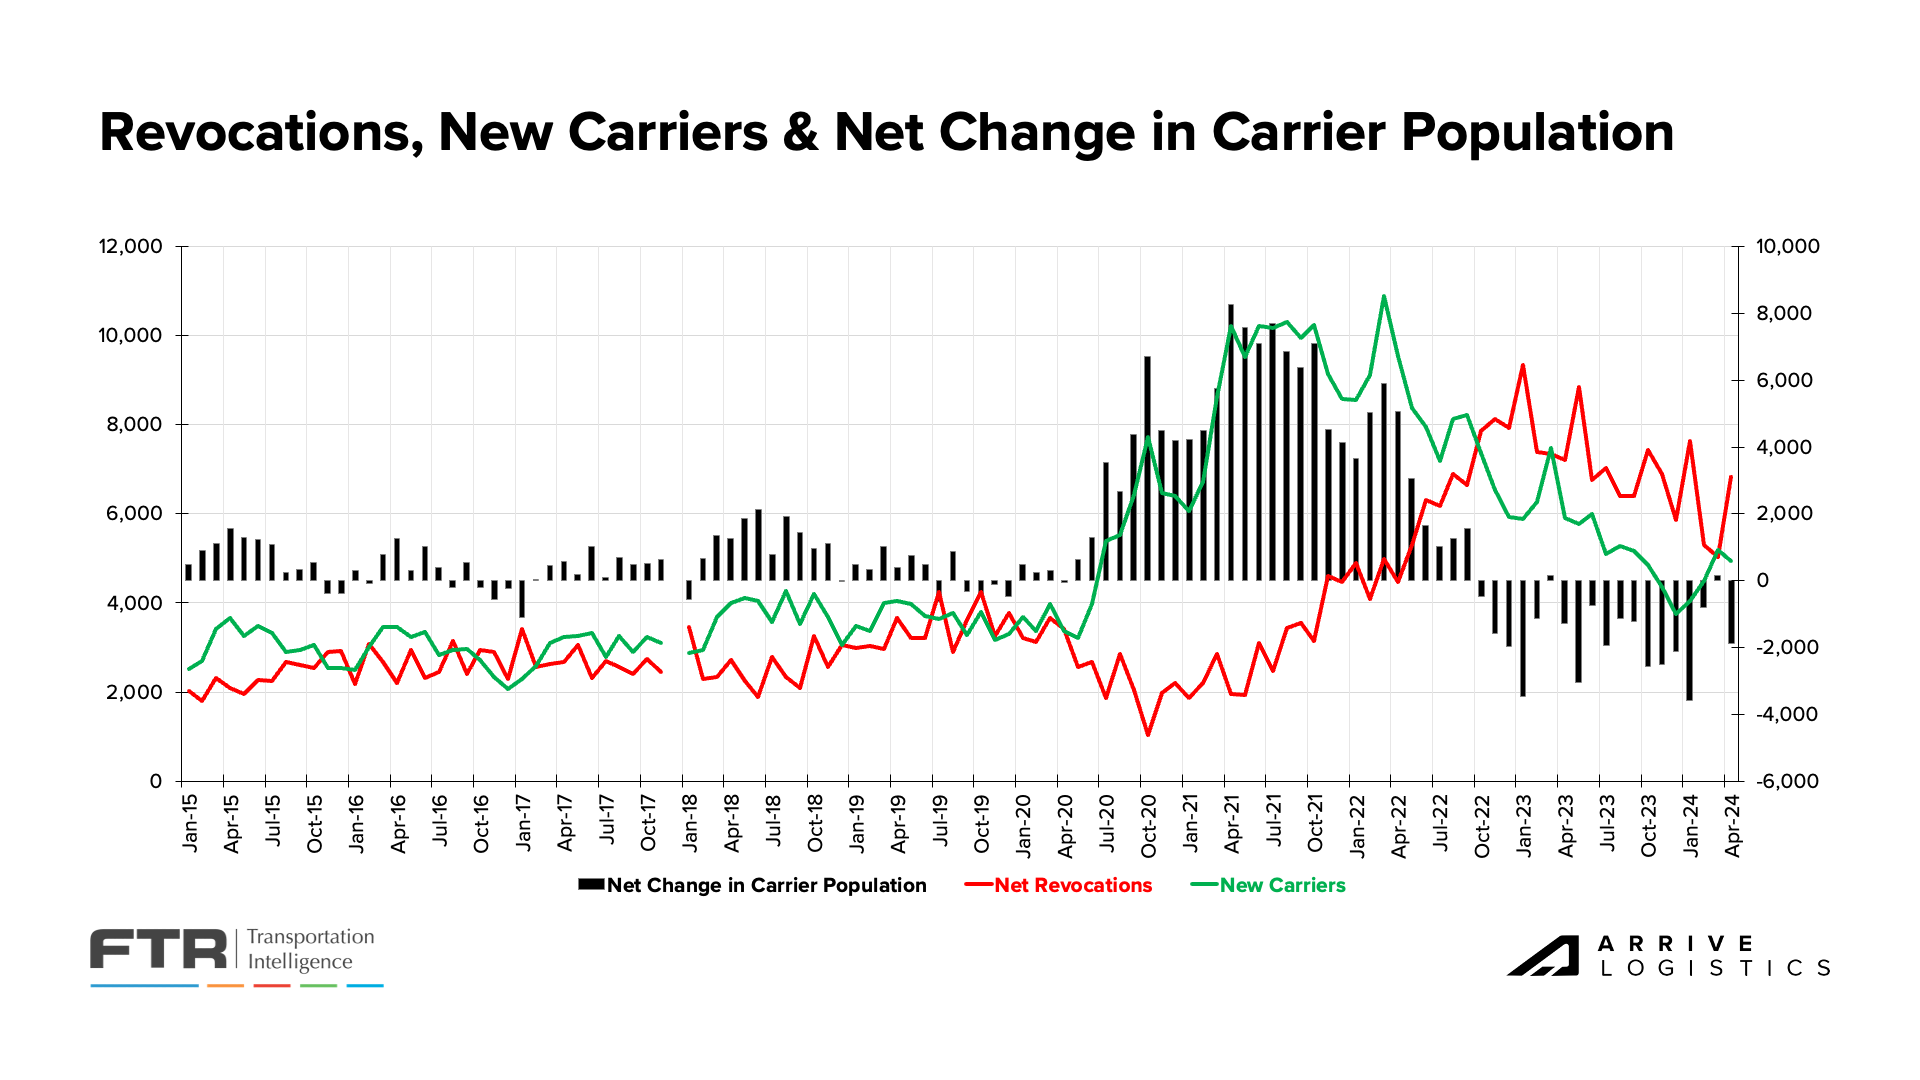 Carrier Revocations, New Carriers & Net Change in Carrier Population, FTR
Overall capacity levels remain elevated despite consistent net carrier population declines since late 2022. Avery Wise of FTR reports that there are still nearly 15% more for-hire carriers than in March 2020. While high, that number is down from its peak of 18% in July 2022. Despite the ongoing correction, it may be some time before a meaningful capacity crunch occurs.
 Driver capacity changes vs. March 2020, FTR
ACT Research reported 7,500 Class 8 truck orders in June, down from 11,000 in May. The decline is unsurprising as orders tend to soften during the summer. However, orders have fallen below replacement levels in four of the last five months, which could be a positive sign for those waiting for the capacity market to shrink.
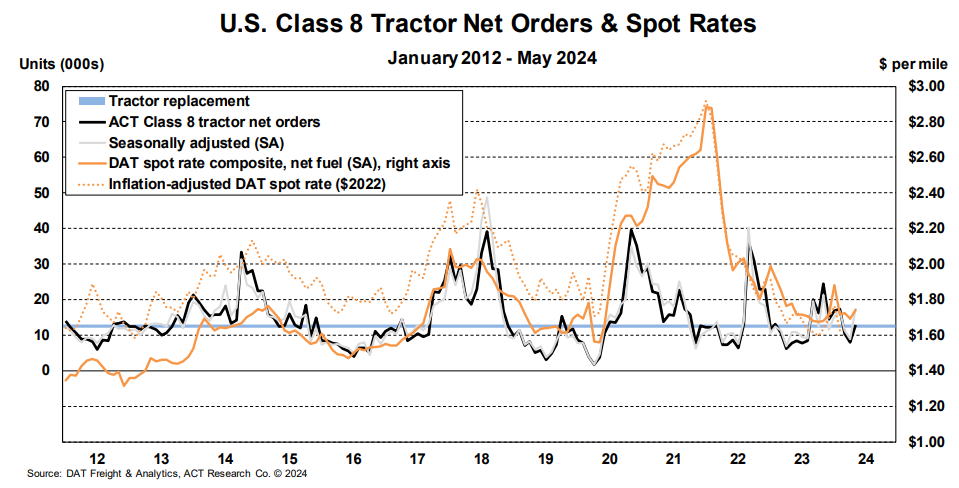 U.S. Class 8 Tractor Net Orders & Spot Rates, ACT Research
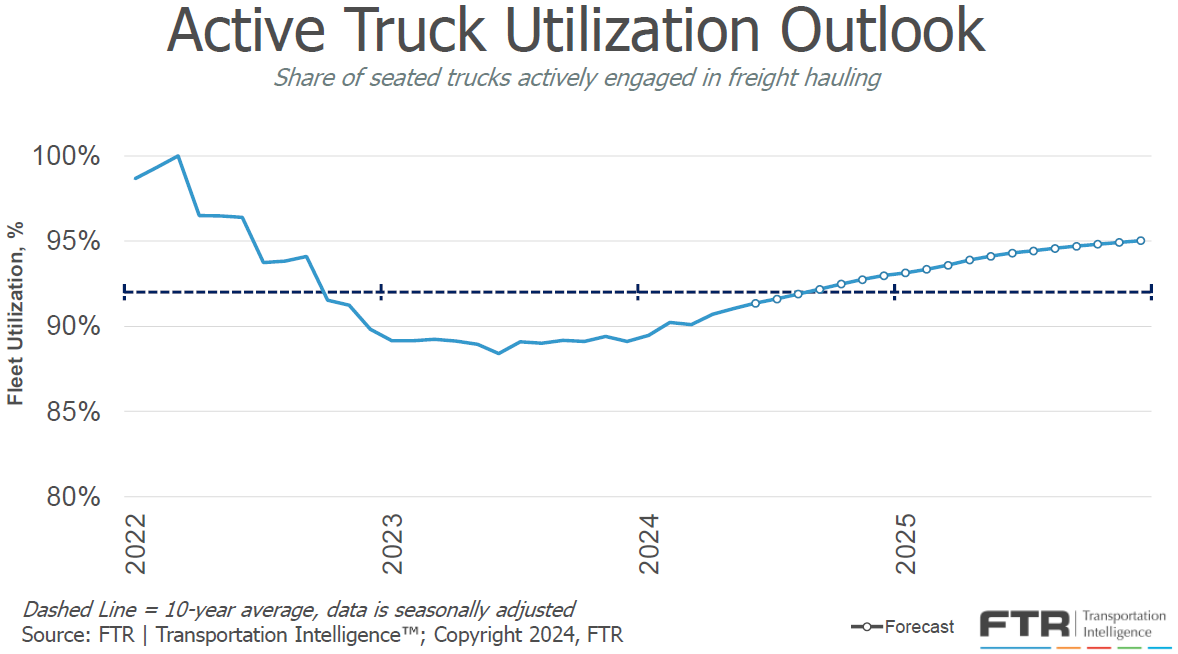
FTR revised its truck utilization forecast downward due to a weaker freight outlook. However, it is clear that utilization bottomed out in mid-2023 and has consistently ticked up since. Active utilization was 91% in May 2024, one percentage point below the 10-year average, and will likely approach 93% by the start of 2025 — another sign that the market is moving toward balance.
 Active Truck Utilization, FTR
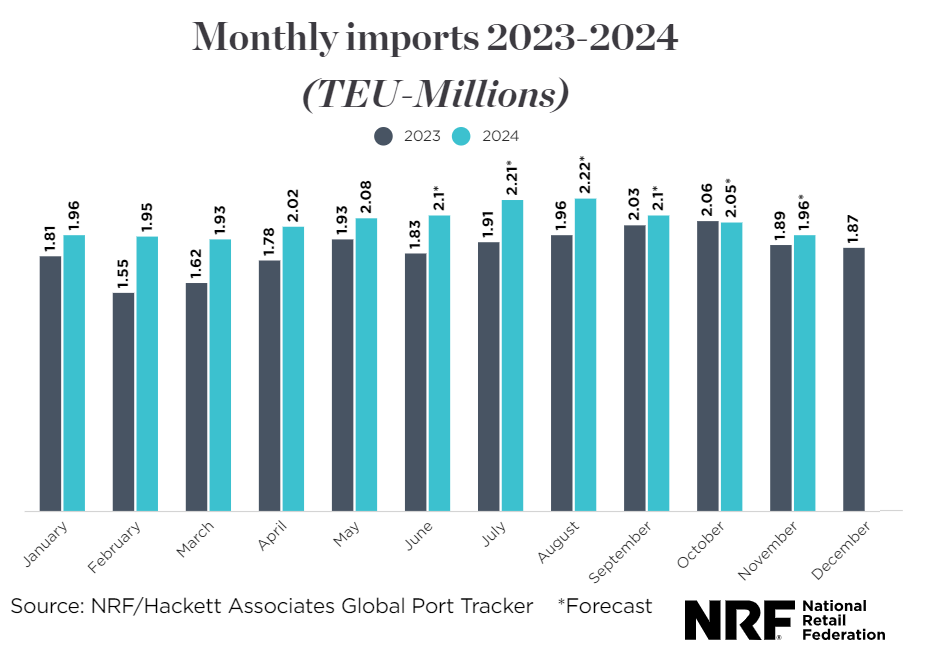
Overall, the volume outlook remains positive. The National Retail Federation (NRF) still expects over two million TEUs monthly until November. U.S. ports handled 2.08 million TEUs in May, an increase of 7.7% year over year and 3% month-over-month. The NRF’s forecast also calls for 4.43 million TEUs to move through U.S. ports in July and August, which would be an 18.4% year-over-year increase.
Increased imports indicate that retailers are restocking inventories in anticipation of strong holiday consumer demand. While this data is encouraging, we caution that retail orders are not always a true indicator of future retail spending. If retail executives overorder, it could create inventory stockpiles similar to those of the post-COVID era, which would have a deflationary impact on the freight market.
 NRF Monthly Imports
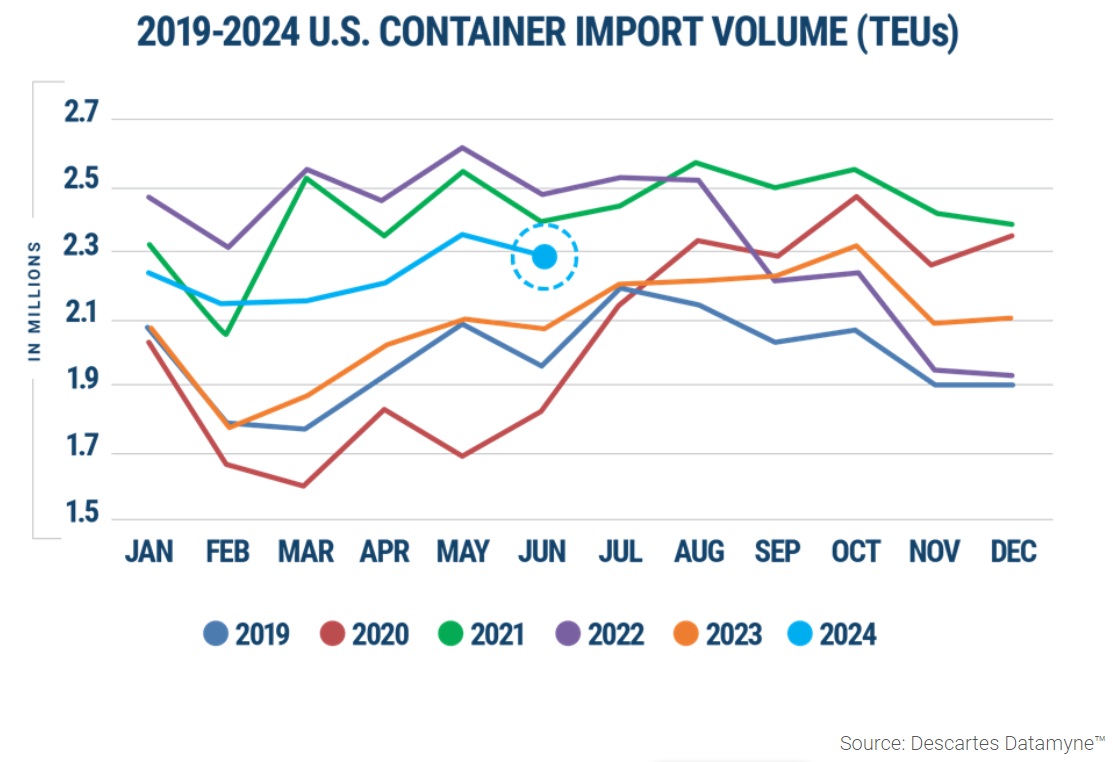
Descartes’ June import data deviated slightly from the NRF’s projections, showing a 2% decrease from May. However, volumes were still up over 10% year-over-year, indicating a strong import market.
Chinese import volumes were up 13.8% year-over-year, which is unsurprising as retailers restock inventories and shippers work to import goods before tariffs increase starting in August. This trend might also explain why West Coast ports handled more volume than East and Gulf Coast ports for the first time since January 2024.
 U.S. Container Import Volume 2019-2024, Descartes June 2024 Global Shipping Report
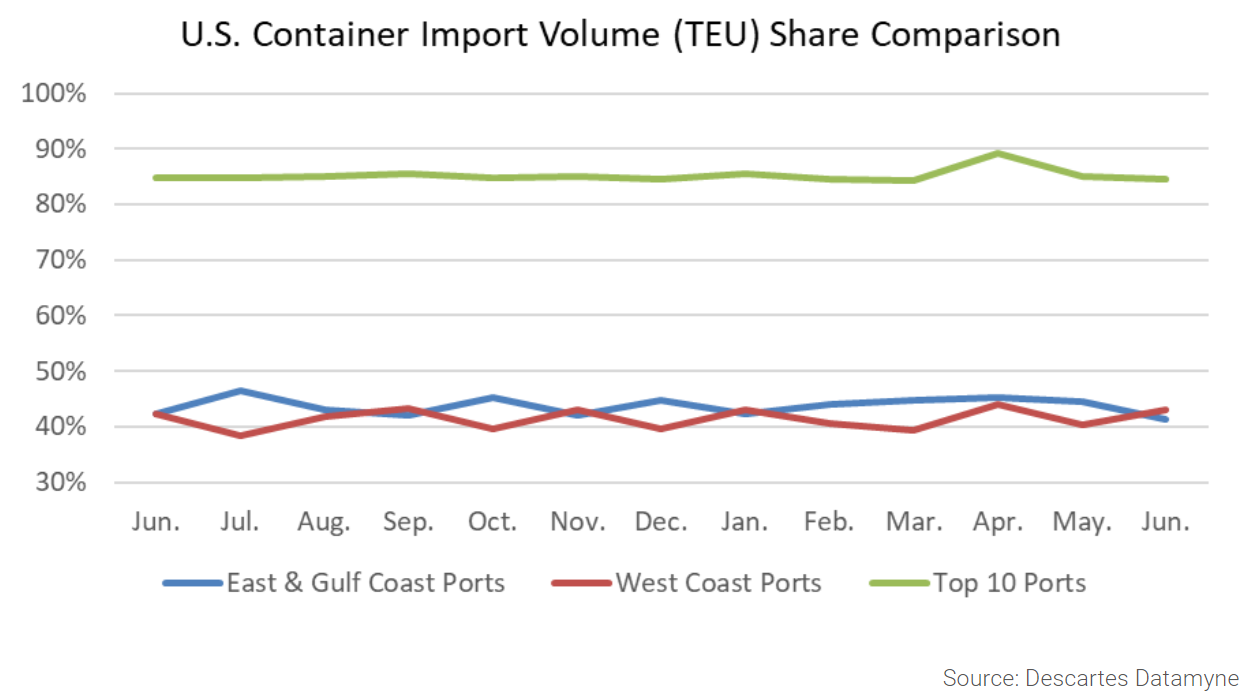 U.S. Container Import Volume, Descartes June 2024 Global Shipping Report
Overall, consumer health indicators still look relatively strong. Industrial production and manufacturing increased by 0.9% month-over-month, but the sector remains relatively flat year-over-year. Housing starts declined 5% month-over-month and nearly 20% from May of last year and will likely remain low amid high mortgage rates. Thus, truckload demand remains flat, but we will continue to monitor these industries as key drivers of freight demand fluctuations.
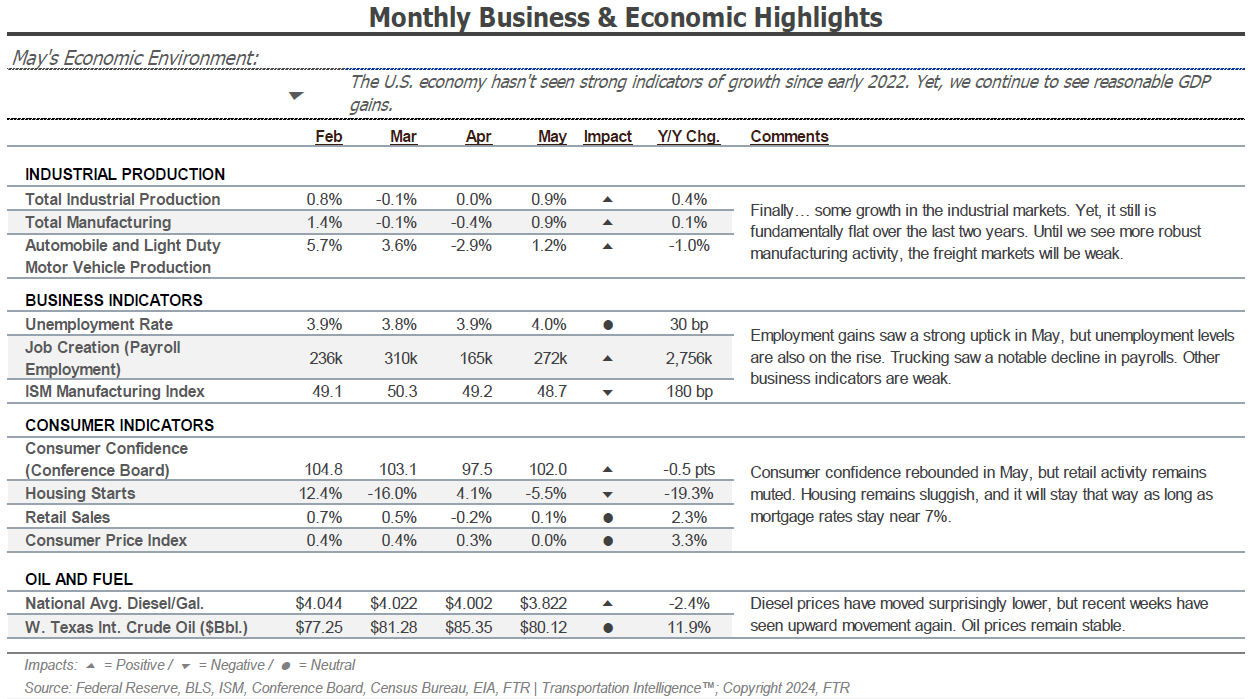 Monthly Business & Economic Highlights, FTR
FTR’s latest truck loadings forecast calls for a 1.1% year-over-year increase by the end of 2024, a downward revision from last month’s 1.8% projection. The 2025 forecast was revised from 2.4% last month to 2.2%, largely driven by an updated bulk and dump loadings forecast that calls for 0.6% growth by year-end, down from the 3.6% projected last month. The remaining modes were relatively steady despite slight downward revisions. These changes reflect a market that is likely to be slow for most of the year.
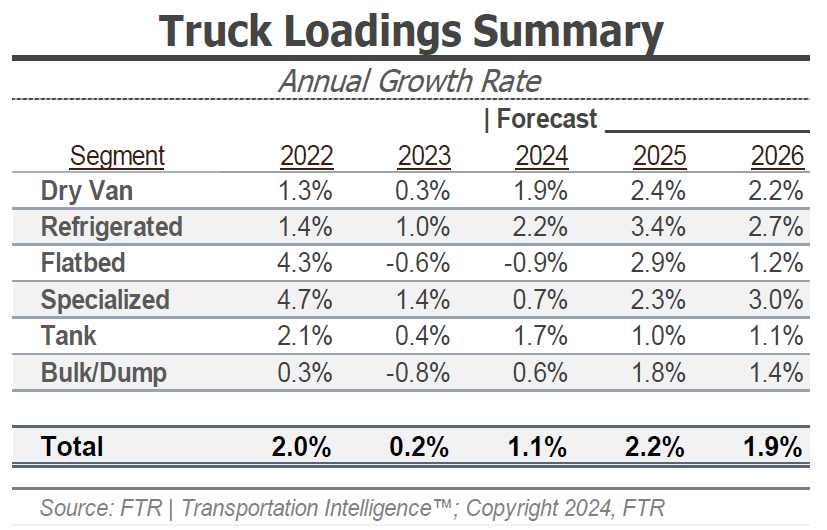 Truck Loadings Summary, FTR
Inflation fell from 3.3% in May to 3.0% in June. While this is good news for customers, more than one rate cut this year is still unlikely, and the true impact of cooling inflation won’t take effect until 2025. Rate cuts would likely jump-start economic activity and spending as borrowing costs decline. However, because rate cuts may come with other less positive economic data that could offset any gains, we caution against making this a trend of focus.
Bank of America reports that credit and debit card spending decreased by 0.5% year-over-year in June. This was also the first month-over-month spending decline since January 2024. However, strong spending in April supported a 0.3% increase in Q2, indicating a positive trend overall. Services sector spending also increased in June, so a meaningful demand decline is unlikely in the near term.
 Bank of America Total Card Spending


