
"*" indicates required fields
"*" indicates required fields
"*" indicates required fields
"*" indicates required fields
After a volatile start to the year—marked by the bullwhip effect of Q4 tariff-related pull-forward volume and severe winter storm disruptions in January—market activity eased in February and remains quiet as of mid-March. In line with seasonal patterns typical of Q1, demand, supply and rates have all softened month-over-month. However, several variables continue to complicate the near- and long-term freight market outlook.
Persistently weak demand and low rates have challenged many carriers to right-size their fleets for maximum efficiency, leaving supply tighter and more vulnerable to disruption than it was a year ago. Though significant demand shocks seem unlikely in the near term, produce season, DOT Roadcheck Week and the 100 Days of Summer will all test the tightening capacity market and provide a good indication of where we stand in the cycle.
Broader economic trends are influencing consumer sentiment and, in turn, freight demand. Though spending remains relatively strong, elevated interest rates, sticky inflation and uncertainty around how tariffs might impact the price of goods have many consumers de-risking. This trend, combined with The Federal Reserve’s stance that the economy is healthy enough to hold off on additional cuts despite consumer uncertainty, creates a downside risk to demand.
So, what does all this mean for the freight market and your business? Simply put, more of the same, at least for now. Demand should hold steady and get a helpful boost from early produce season and outdoor goods shipments, but a surge significant enough to make spot rates cross contract rates remains unlikely. However, that could change as supply continues to contract over the next few months.
Shippers can count on routing guides remaining relatively intact while these conditions last, as carriers will continue to honor contractual commitments. Those moving freight outbound from southern regions should expect some rate increases as capacity tightens with the start of produce season, but any volatility should be short-lived.
For a closer look at the data driving these trends and insights into the potential implications, keep reading.


Despite shippers’ aggressive Q4 pull-forward efforts and January winter storms stirring up some volatility in Q1, indicators still show a softening demand environment in early 2025.
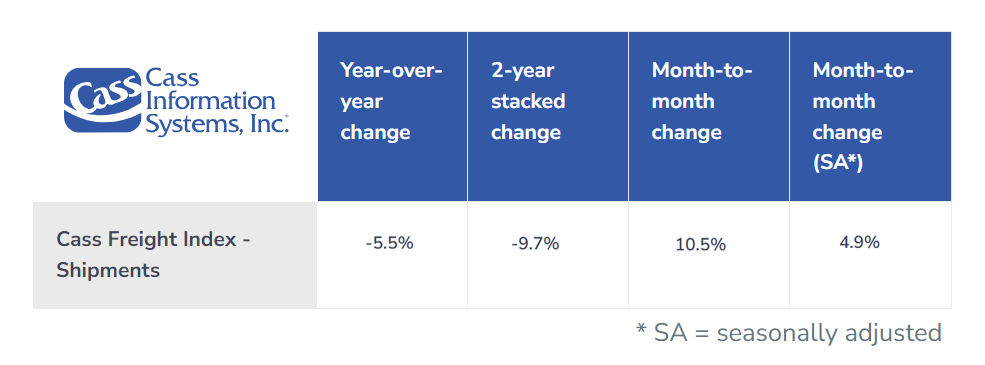
Contract load accepted volumes declined month-over-month as severe weather subsided, shippers wrapped up pre-stocking, and the typical Q1 volume slowdown set in. The Cass Freight Index reflected this trend, showing an 8% year-over-year dip in January and a 15% two-year decline.
Spot load activity fell slightly from January to February but increased modestly year-over-year, due at least in part to increased cross-border freight shipments with Canada and Mexico ahead of tariffs going into effect.
Demand has been following normal seasonal patterns but weakening overall for some time, and several downside risks indicate this trend is likely to persist in the near term. However, the broader economic and political complexities at play make it difficult to accurately predict significant or specific changes to current demand levels.
That said, March and April volumes may get a boost from lawn care products and other seasonal freight. Early-season produce shipments from Mexico are also starting to increase volumes and create capacity constraints in South Texas. This tightening is expected to expand further as the produce season progresses.

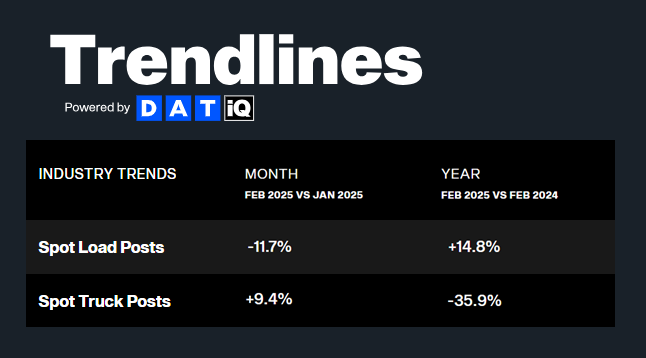
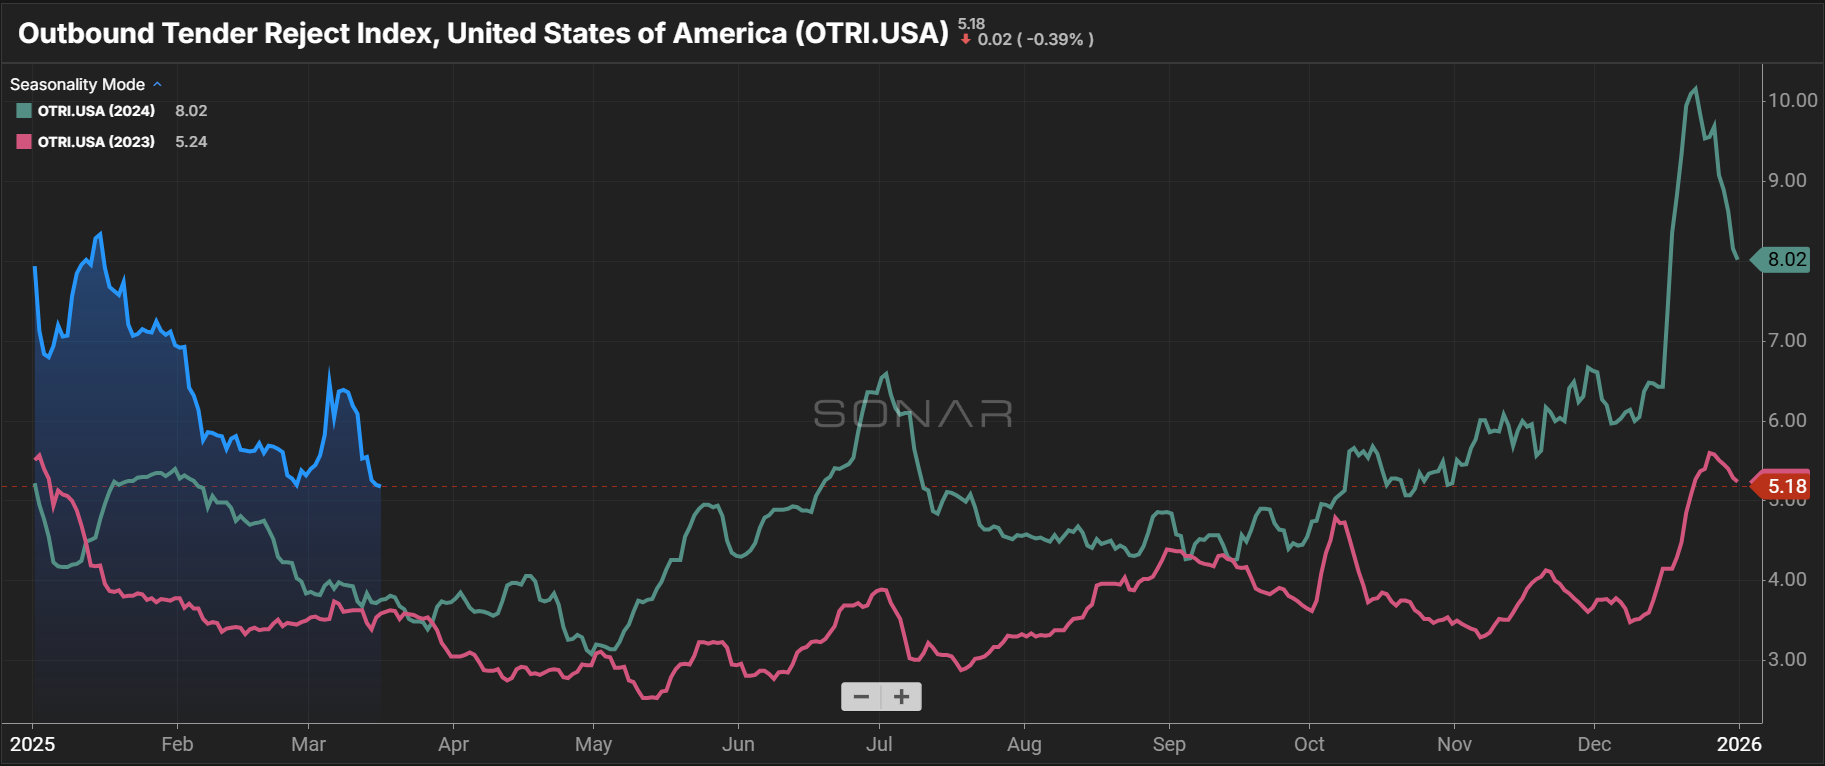
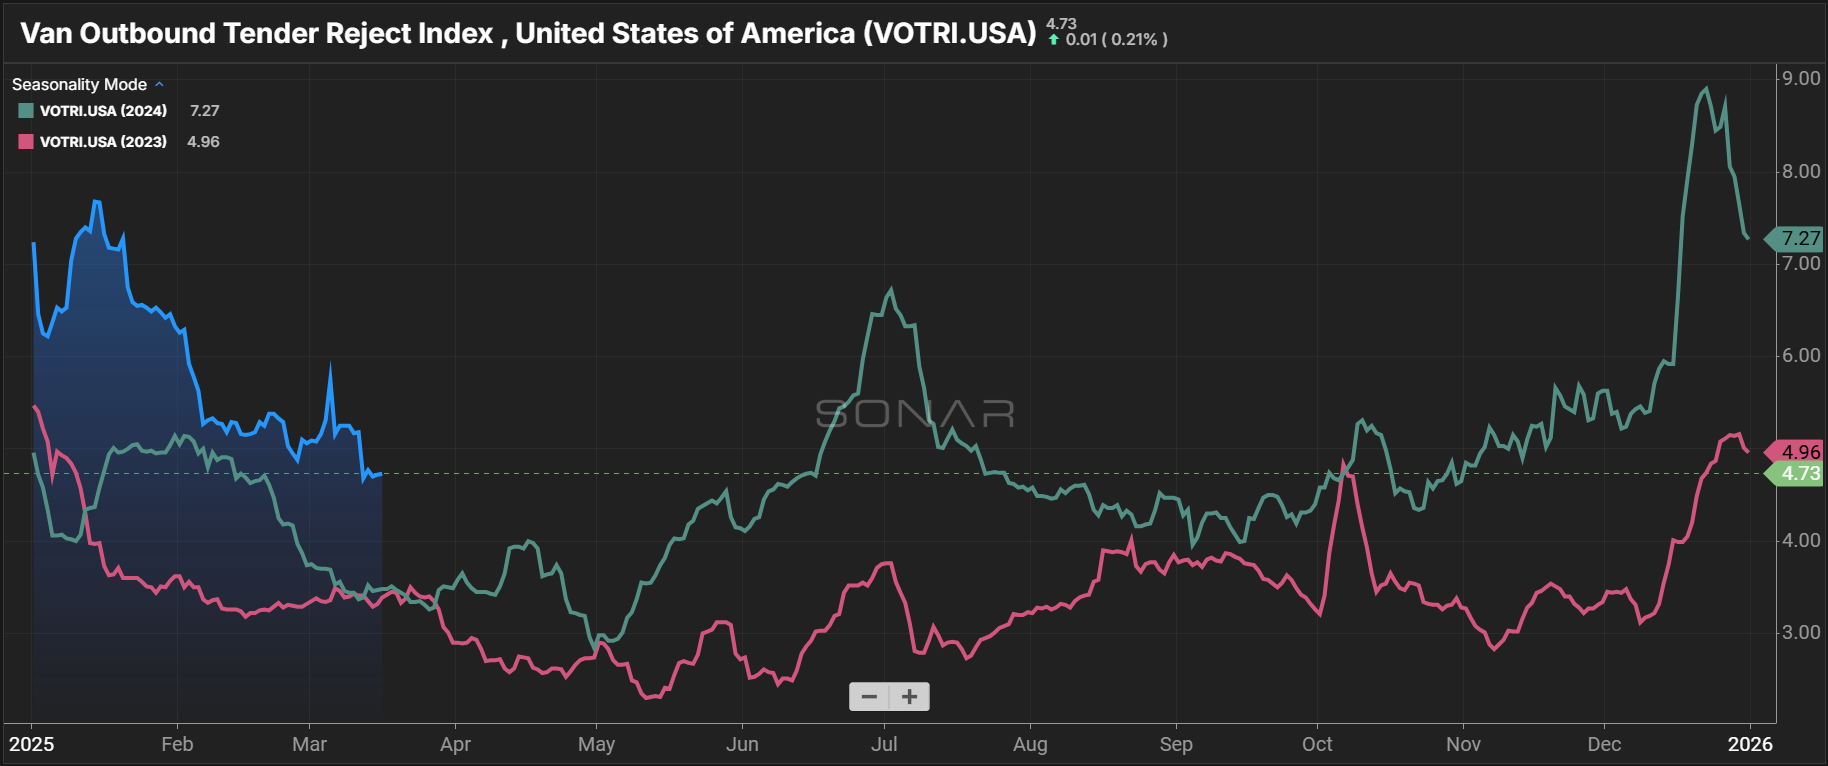
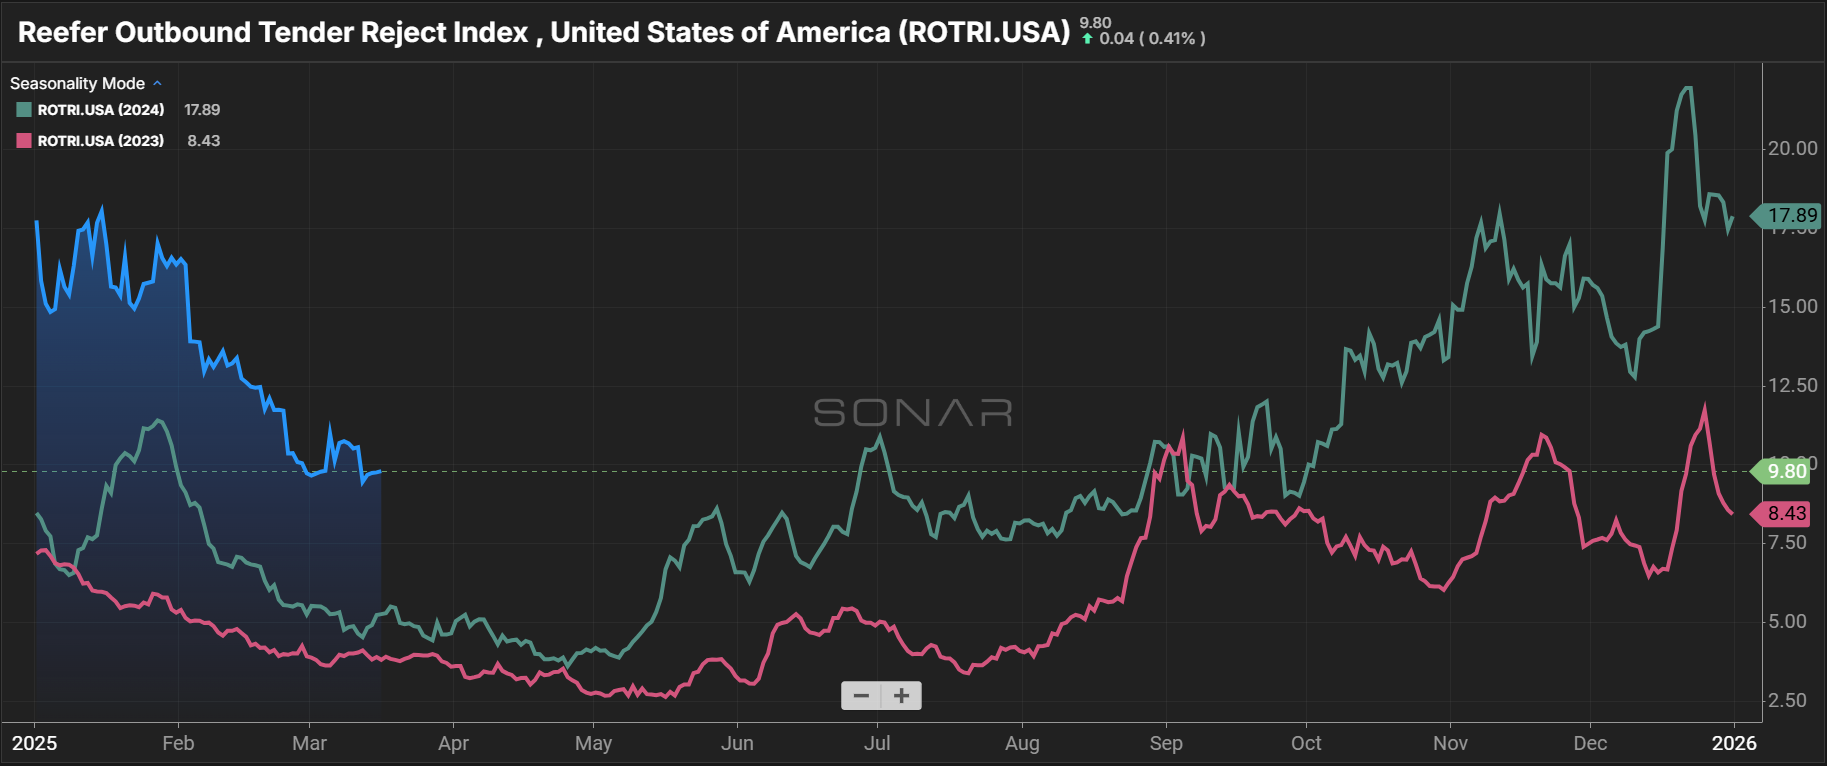
Capacity conditions eased in February in line with typical seasonal trends. Similar to Q4 peak season activity, tender rejections and load-to-truck ratios are trending slightly higher than a year ago. While this indicates a more balanced capacity network, supply levels remain very manageable for shippers.
Carrier exit and trucking employment data both point to a more controlled burn at this point in the cycle. An analysis from FTR shows that the carrier exit rate is down to approximately 570 per month in 2025, compared to 1,700 per month in 2023 and 1,000 per month in 2024. Trucking employment data confirms this trend. Despite some fluctuations related to market sentiment, employment has largely leveled off and followed only a modest downward trajectory since mid-2024.
While the aforementioned efficiency adjustments have helped carriers stay afloat amid challenging conditions, running lean also leaves them—and, therefore, the market—more vulnerable to future demand shocks. However, with the slow rate of carrier exits and a lack of apparent upside risks to demand in the outlook, the likelihood of a sustained disruption in the near term remains low.
Rates eased in line with seasonal expectations from January to February, with the national average linehaul rate dropping by $0.11 per mile and reefer linehaul rates falling by $0.20 per mile. These spot rate declines further widened the spot-contract rate gap, reducing the likelihood of a significant near-term disruption.
March and April rate movements tend to vary based on market conditions. While declines are most typical given the slow pace of February, rates rose sharply in 2018, 2020 and 2021 amid the significant disruptions during those periods.
This year, rates have declined in March and should reach a 2025 low point in April. Even with produce season demand ramping up in the coming weeks, the market’s next true test likely won’t come until DOT Roadcheck Week from May 13-15 and the start of the 100 Days of Summer shortly thereafter.


From selling off volatile assets to postponing large purchases and shifting spend toward discounted retailers amid high goods prices, economic uncertainty appears to be steering cautious consumers toward de-risking measures.
Still, overall consumer spending remains relatively strong. Though Bank of America reported a 2.3% year-over-year decline in February card spending, a seasonally adjusted 0.3% month-over-month increase suggests momentum hasn’t faltered entirely.
Despite fairly healthy spending, concerns about inflation, interest rates, stock market volatility and the potential impact of tariffs continue to weigh on consumer confidence.
However, in a recent speech, Federal Reserve Chair Jerome Powell noted those fears may be unwarranted. “Despite elevated levels of uncertainty, the U.S. economy continues to be in a good place,” said Powell. “The labor market is solid, and inflation has moved closer to our 2 percent longer-run goal.”
In turn, it appears the Fed will not make additional cuts in the near term. While this should keep further volatility at bay for now, persistently high inflation and interest rates could ultimately pose a downside risk to freight demand.


East Coast
Northeastern outbound rates are declining as produce season begins in the South.
Shippers can expect regional tightening as produce season begins in Florida and Georgia.
Midwest
Midwest markets are soft, with outbound rates to the Southeast declining rapidly.
Central
South
Border cities, including Houston, are experiencing increased volatility amid tariff concerns and the start of Mexico’s produce season; this trend is likely to continue heading into the 100 Days of Summer.
West Coast
Northern California markets are quiet but will tighten starting in April.
Demand and rates remain high in Calexico, Yuma and Nogales.
Pacific Northwest (PNW)
Conditions have settled following some capacity tightness and rate increases in early February.
The market should remain soft through the summer.
Get this free report delivered straight to your inbox every month.
