
"*" indicates required fields
"*" indicates required fields
"*" indicates required fields

Our research indicates that the volatility in truckload demand tied to the retail peak shipping season and the shift in consumer spending patterns will put additional stress on the already constrained capacity environment we are experiencing today, causing elevated rates and a more active spot market throughout the remainder of the year and likely through the first half of 2021. Below are a few high-level takeaways from the report:
Spot volumes moderated slightly in October, but are back on the rise in early November, indicating that the retail peak season is underway
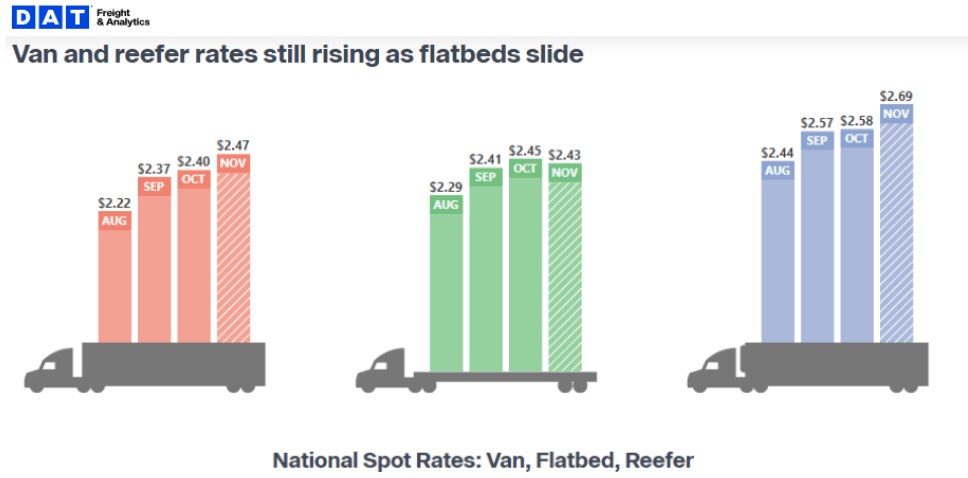
Dry van spot rates climb to all time highs of $2.40 per mile in October despite the slight easing of relative capacity, a sign that carriers are maintaining pricing power
Dry van and refrigerated spot rates have continued to increase relative to their respective contract rates, an indication that shippers struggles to maintain routing guides are increasing
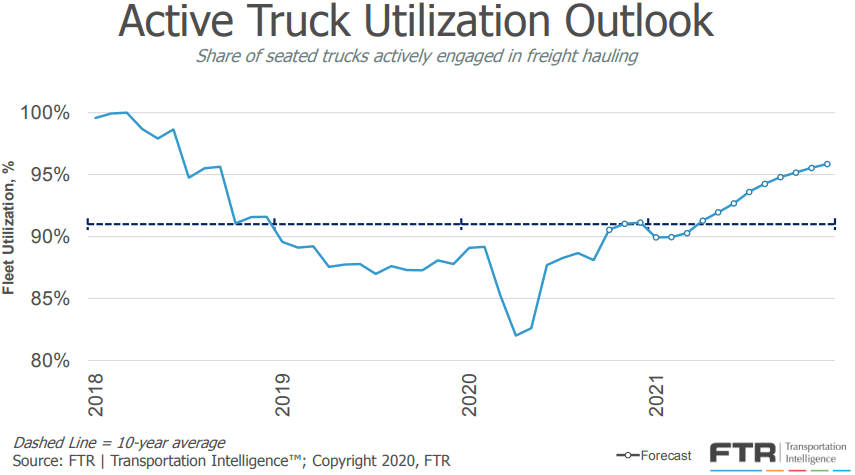
Driver shortages have led to lower active truck utilization for carriers and should result in sustained capacity constraints through at least the first half of 2021
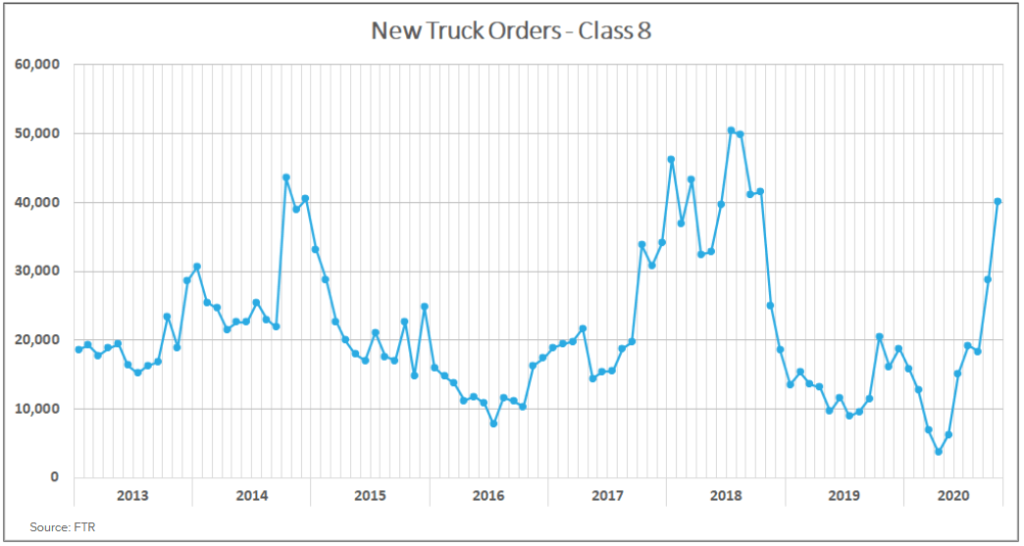
New truck orders increased significantly to more than 41,000 units in October, evidence carriers are investing in expanding their fleets
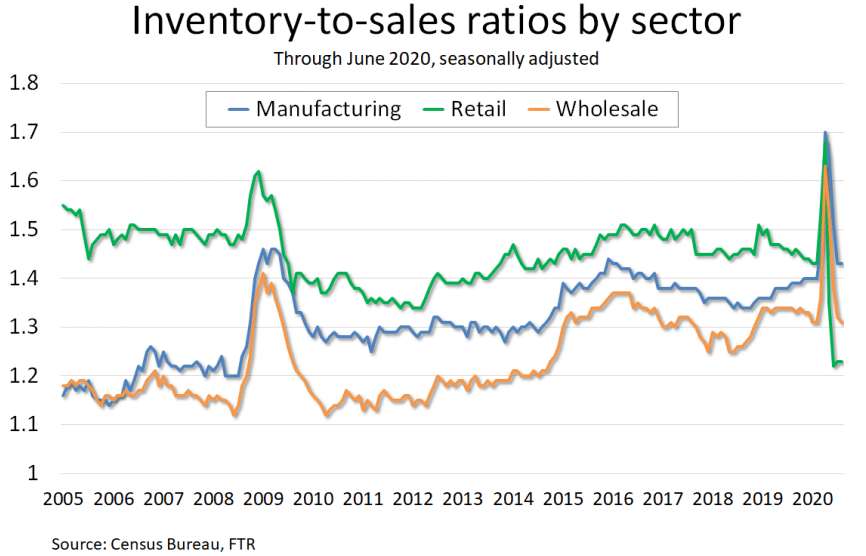
Inventory-to-sales ratios are at an all time low due to increased consumer spending on retail goods, fueling a sustained import rally to enable restocking of depleted retail inventories
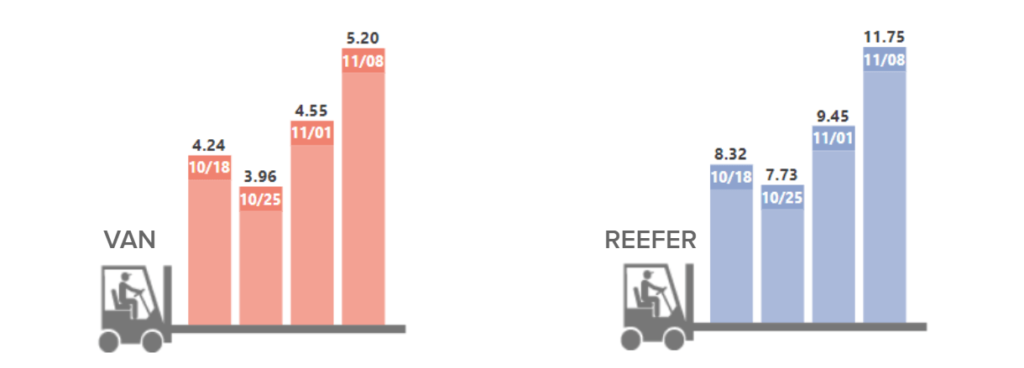
Longhaul tender rejections out of southern California are on the rise as a result of the demand for capacity to support the nationwide restocking effort
Americans’ spending patterns have remained consistent, they are traveling less and spending more on freight heavy durable goods, such as furniture, electronics and home improvement
Tender Volumes are representative of nationwide contract volumes and act as an indicator of Truckload Demand
Tender Rejectionsindicate the rate at which carriers reject loads they are contractually required to take and acts as an indicator of the balance between Truckload Supply and Demand
New Truck Orders is an indicator of the trucking industry’s health and carrier sentiment, as carriers typically invest in new trucks when demand and optimism are high.
Industrial Production measures the output of the industrial sector, including mining, manufacturing and utilities.
US Customs Maritime Import Shipments, China to the United States measures the total number of import shipments being cleared for entry to the U.S. from China.
Rate Spread measures the difference between the national average contract rate per mile and the national average spot rate per mile and is closely inversely correlated to movements in tender rejections and spot market volumes.
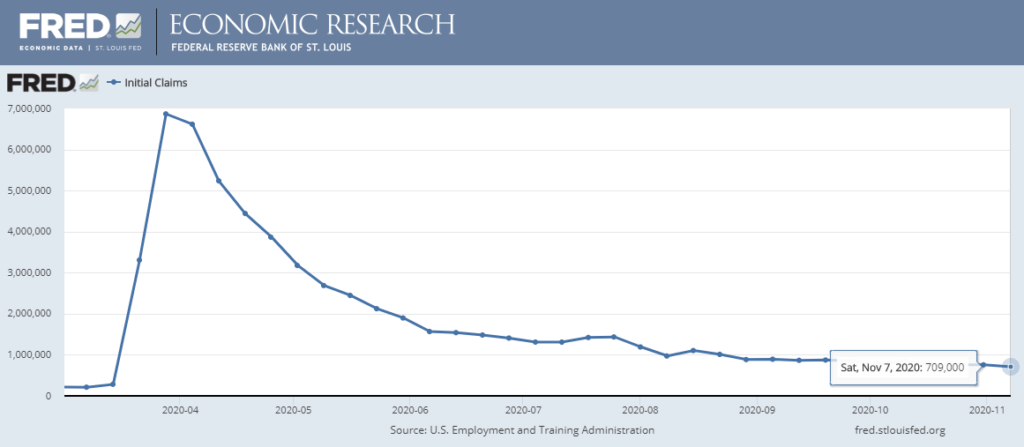
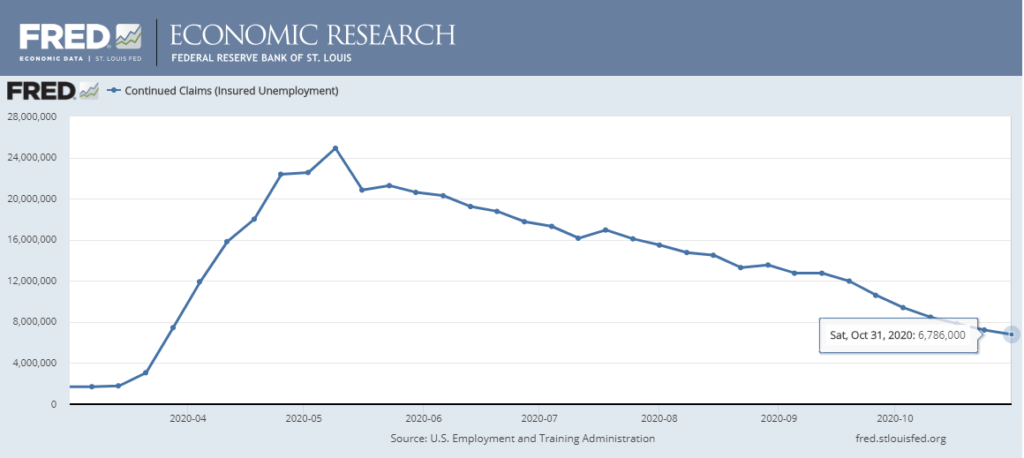
Weekly Jobless Claims are used as a barometer for the pace of layoffs in the general economy.
Unemployment Rate is the number of people who are unemployed that are actively seeking work.
"*" indicates required fields
In October, we believe that demand conditions moderated slightly from the peak seen in September. This is a trend seen annually following September, where demand surges due to Labor Day and the end of quarter push. We continue to see discrepancies in year-over-year volume trends across different indices, with those heavily concentrated with consumer goods showing increases, and those that consider the industrial and energy sectors continuing to post year-over-year declines. Spot volumes continued to remain strong near all time highs as shippers are still navigating the carrier network imbalances sparked by volatility in truckload demand across different sectors.
FreightWaves SONAR Outbound Tender Volume Index (OTVI), which measures contract freight volumes across all modes, is up more than 65% year-over-year in November but moderated slightly in October, where volumes at the end of the month were roughly flat compared to the start of the month. It is important to note that OTVI includes both accepted and rejected load tenders, so we must discount the index by the corresponding Outbound Tender Rejection Index (OTRI) to uncover the true measure of accepted tender volumes. If we were to apply this method to the year-over-year OTVI values, the increase in volume drops to roughly 22.7%. The Dry Van and Reefer Tender Volume Indices were also up more than 55% and 75% year-over-year, which equated to 24.4% and 5.7% increases in actual volumes for the two modes, respectively. The Dry Van Index was flat in October, but the Reefer Index continued to climb and is up more than 8% month-over-month.
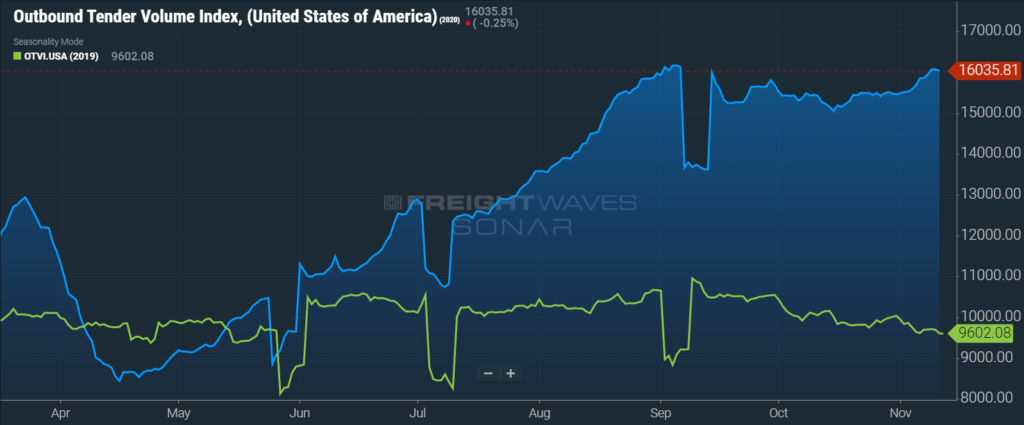
DAT reported that dry van load posts took a slight step back in October, falling 5.9% month-over-month from all time highs in September, but have climbed by more than 122% year-over-year.

In the final week of October, FTR and Truckstop’s Total All Mode Spot Volume Index was down by about 7% from September, up 102% year-over-year and 100% since 2018. These demand trends were driven by an 8% month-over-month decline from a record high, and 126% year-over-year increase, for the Dry Van Spot Volume Index. The Reefer Spot Volume Index increased by roughly 11.8% in October and 79% year-over-year.
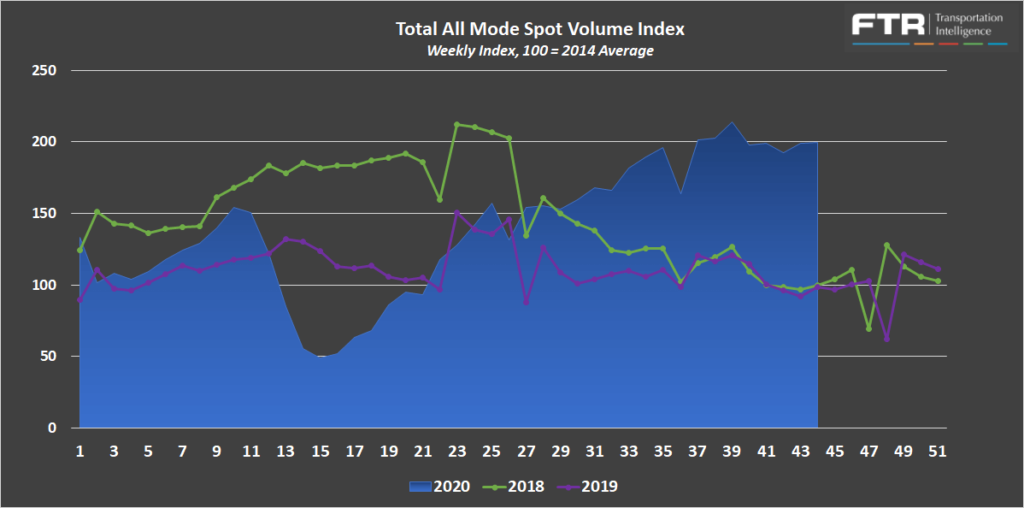
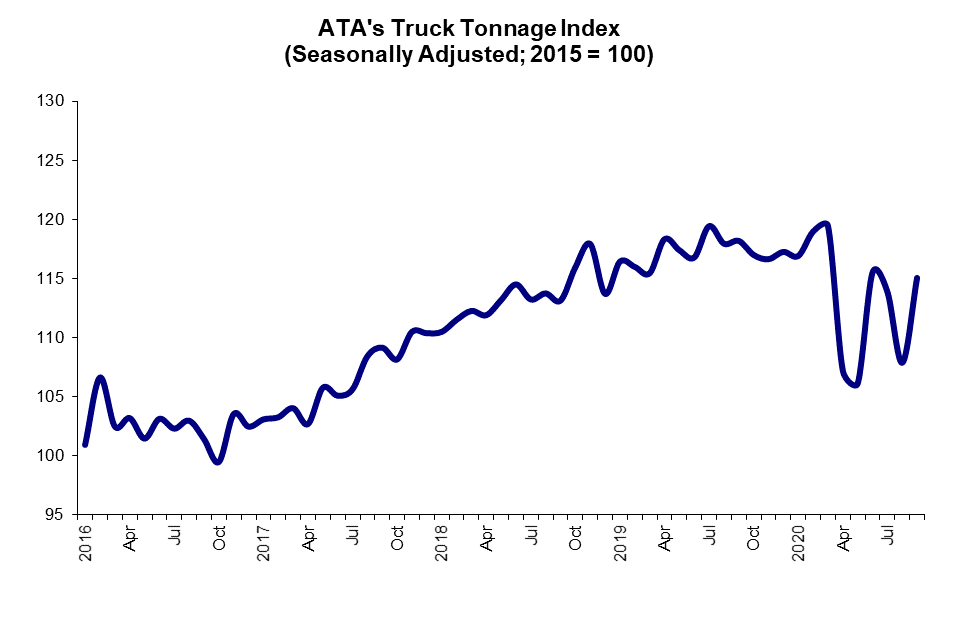
The remaining indices, ATA’s Truck Tonnage Index and FTR’s Truck Loadings Index, continue to indicate that the total trucking market is down on a year-over-year basis.
The Seasonally Adjusted ATA Truck Tonnage Index increased 6.7% month-over-month, but remained down for the sixth straight month, to 2.7% year-over-year.
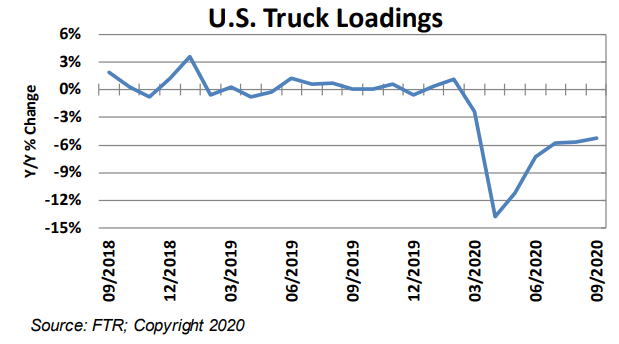
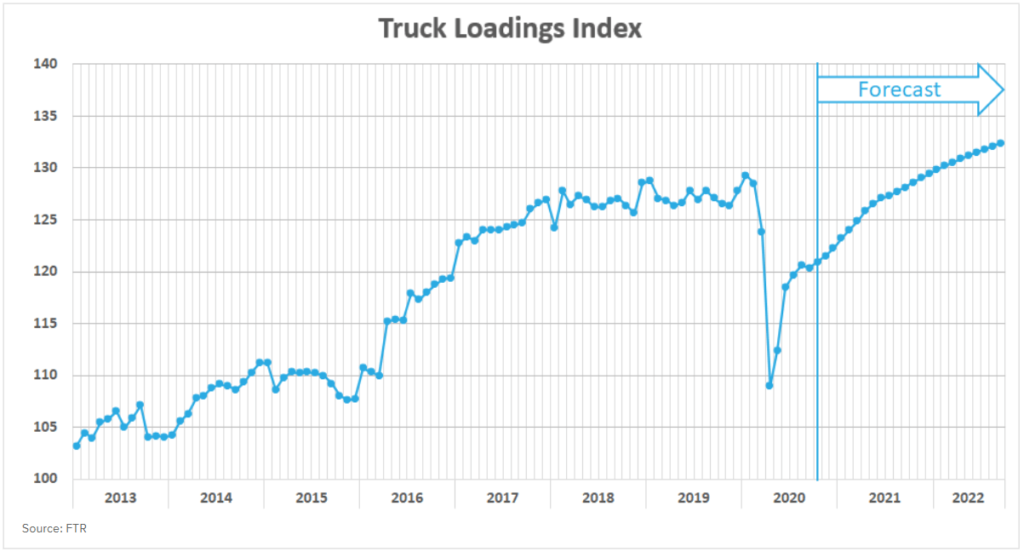
FTR’s Truck Loadings Index was down by 5.3% year-over-year in September but remained relatively flat month-over-month.
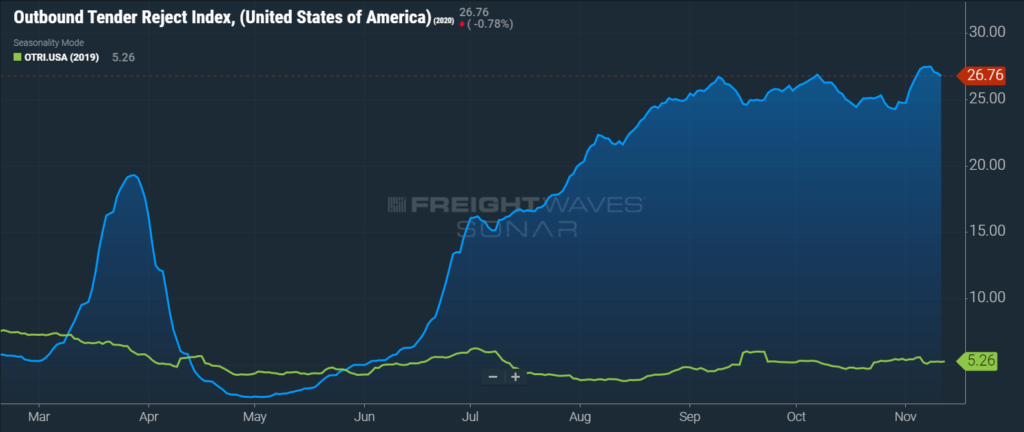
Sonar Outbound Tender Reject Index (OTRI) measures the rate at which carriers are rejecting the freight that they are contractually required to take. Tender rejections peaked at a then record high 26.86% in October before moderating throughout the month as the market conditions eased slightly. Tender rejections have since set a new record of 27.47% in November. This was an increase of more than 400% year-over-year. The Dry Van Tender Reject Index peaked in early October at 35.0%, a new record high. Dry van tender rejections have abated since but still remain elevated at 31.2%. Reefer Tender Reject Index of 45.87% in early October was a new record high until November where reefer tender rejections topped out at 47.78%.
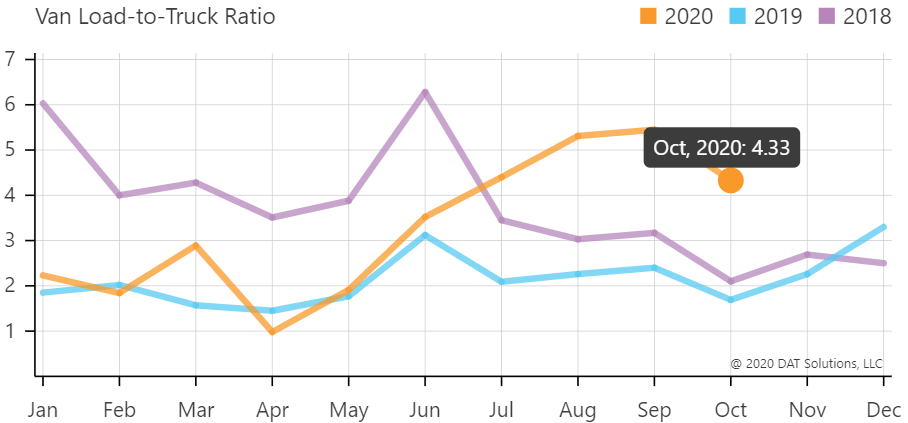
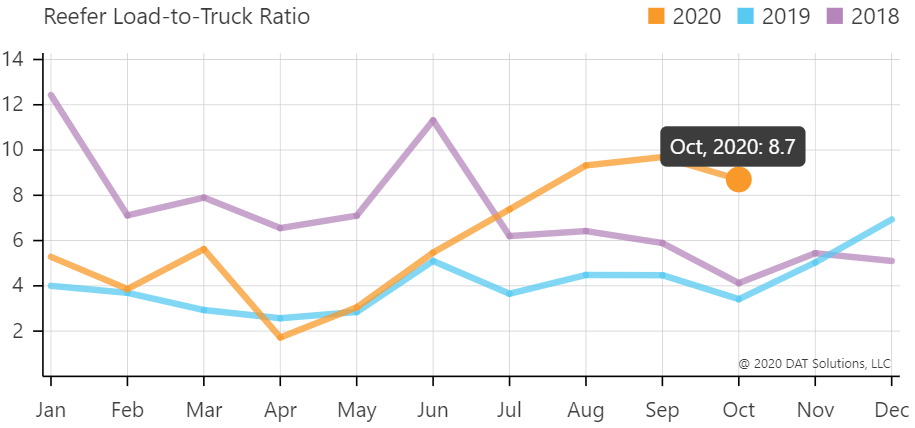
The DAT Load to Truck Ratio measures the total number of loads posted compared to the total number of trucks posted on their loadboard. In October, the Dry Van Load to Truck Ratio fell to 4.33, a decrease of 21% month-over-month, but remains up 156% year-over-year. The Reefer Load to Truck Ratio fell to 8.7, a decrease of 6.7% month-over-month, but remains up 155% year-over-year. The ratios falling in October are expected on an annual basis in line with the pullback in demand from September. It is noteworthy that the % decreases month-over-month for both Van and Reefer were lower than in previous years; a sign that conditions have remained relatively tight heading into the upcoming peak retail shipping season.
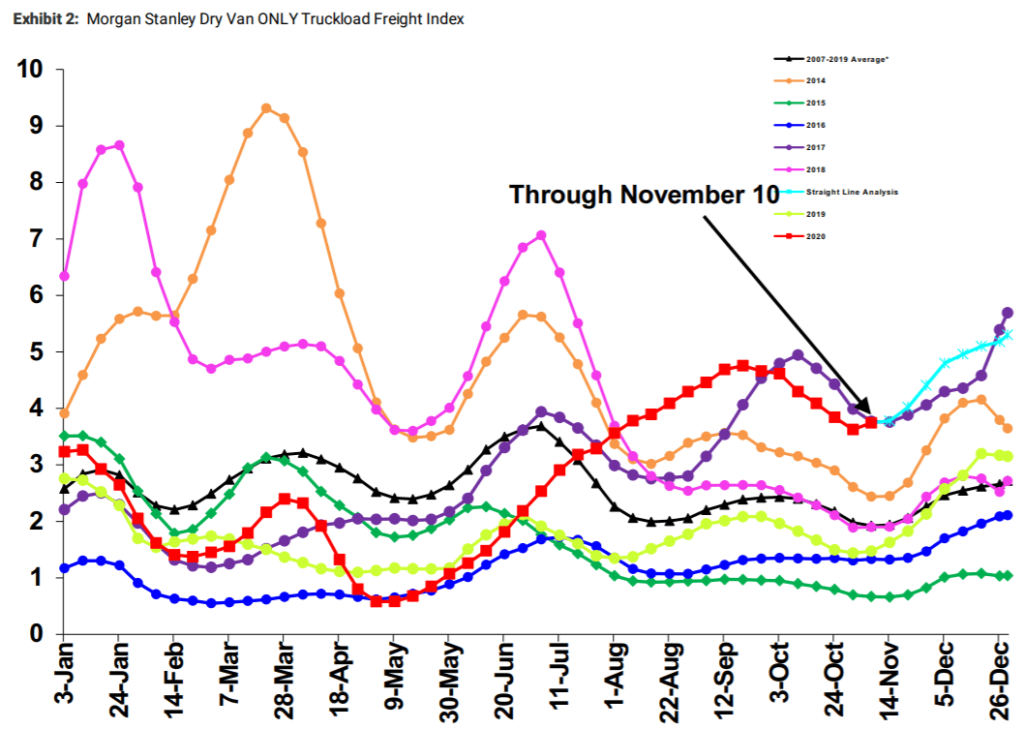
The Morgan Stanley Dry Van Freight Index is another measure of relative supply. The higher the index, the tighter the market conditions. The index is indicating that the conditions we have seen since early October are very closely aligned to the conditions seen in 2017, and we should expect to see the rest of the year play out in a very similar fashion, tightening from here on out.
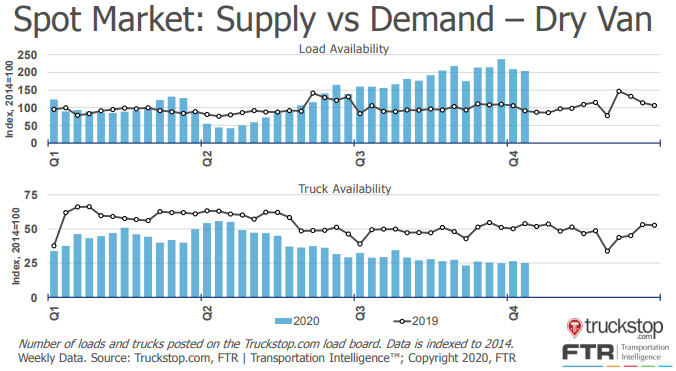
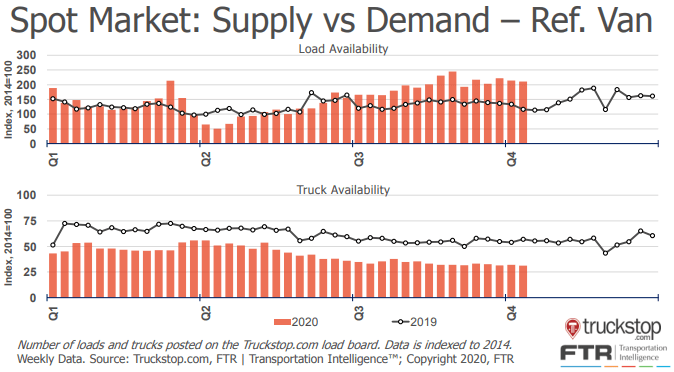
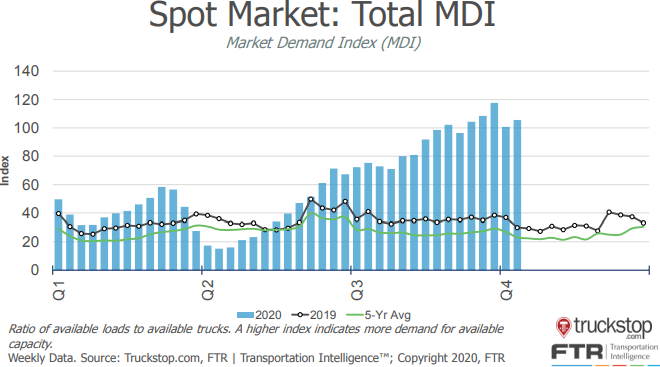
The Truckstop/FTR Market Demand Index measures the ratio of available loads to available trucks. In the first two sets of charts below, load and truck availability are plotted separately for both dry van and reefer freight. In both cases, load availability was up, and truck availability was down year-over-year. This is indicative of tighter market conditions as demand has remained elevated while supply has continued to decrease. The result of these trends is a flat but elevated Market Demand Index which has been trending at or near record highs since early in the third quarter.
Even though demand moderated in October, truck costs continued to increase across all three modes. The DAT reported dry van spot rates increased by 36.7% from $1.80 per mile in June to $2.47 in the first week in November.
The dry van linehaul rpm of $2.40 for the month of October was an increase of 33.0% year-over-year and was the third straight month where rates hit a record high. This shows just how much negotiating power carriers have maintained even though conditions eased slightly in the month. Contract rates increased 16.6% from $1.99 to $2.32 over the same time period.

The Contract-Spot Van Rate Spread experienced a $0.57 swing over a seven month span, from $0.40 in April to -$0.16, an all-time low, month-to-date in November.
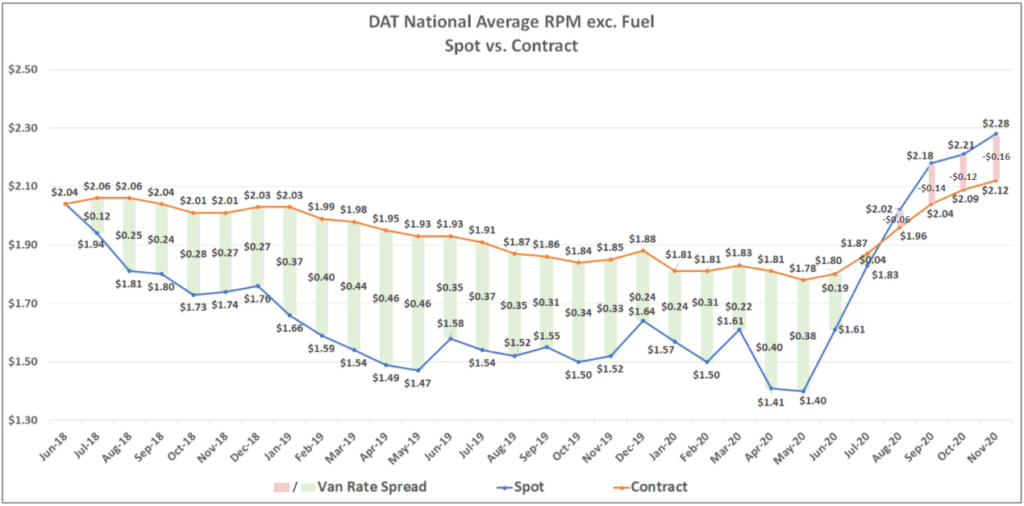
When spot rates are above contract rates, it is a clear sign that we are going through an inflationary cycle in the market, and shippers are likely struggling to maintain their routing guides. The rate spread has continued to increase month-over-month, putting an incredible amount of upward pressure on contract rates.
Capacity constraints are an ongoing issue that will affect the transportation markets for the foreseeable future. The Bureau of Labor Statistics reported that total driver employment was down 4.7% year-over-year in September. Several factors are leading to this growing driver shortage. An aging workforce more susceptible to the virus; increased unemployment benefits; the closing of or limited throughput of driver schools; and the drug and alcohol clearinghouse regulations have led to significant declines in driver availability and active truck utilization.
Stephens Research has reported that driver training school throughput has been severely constrained by the pandemic. Their research indicates that roughly 22% of driving schools remain closed, either temporarily shut down or permanently closed altogether. Of the schools that remain open, 82% of them are operating with limited throughput, running at an average of 57% capacity. With the count of virus cases back on the rise, these figures are likely to increase, further limiting throughput. Stephens Research believes that these headwinds support an extension of the rate cycle longer than what has been seen in previous cycles.
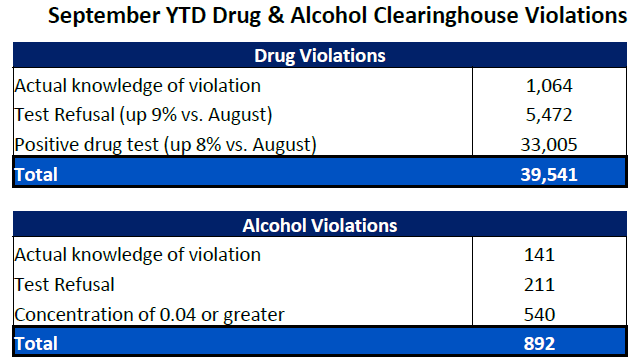
Bank of America’s Q4 Surface Transportation Industry Update touched on the impact of the drug and alcohol clearinghouse regulation that has been in place since January 2020. As of September, year-to-date drug and alcohol violations have resulted in more than 40,000 drivers being removed from the industry. Many believe that the clearinghouse has been part of the reason drivers have not returned to the industry as quickly as in previous inflationary cycles due to the fear of failing a test associated with starting a new job, making the full impact of the new regulation hard to measure. One thing is for sure, the new regulations are having a profound impact on driver availability across the industry.
This has resulted in six straight months of contract rate increases. If trends follow a similar pattern to what was seen in 2018, contract rates are likely to settle well above pre-pandemic levels.
Active truck utilization, the share of seated trucks actively engaged in freight hauling, continues to suffer due to the ongoing challenges with driver availability. That being said, if spot rates continue to climb, drivers will begin to re-enter the market, and active truck utilization should increase. FTR is forecasting that active truck utilization will increase as the market sees a sustained recovery in the industrial and energy sectors in 2021 and 2022.
FTR is reporting that new truck orders increased significantly to more than 41,000 units in October. This is the highest single month total since October 2018 and well above the 20,000 units required to sustain current levels of capacity. It is a sign that carriers are investing in expanding their fleets. In 2017/2018, thirteen straight months of new truck orders greater than 20,000 units were required to correct the capacity shortage. It is worth noting that at the time, active truck utilization was near 100%. We know the imbalance that exists today is more of a result of a driver shortage, so investments in new assets will not be as impactful unless drivers return to the market as well.
Industrial production is an important metric to watch due to its relationship to domestic shipment volumes. Industrial production data is now up to date through the end of September and shows a pullback of -0.6% since last month. The slowing growth is likely due to the declines in auto production, which have seen its momentum fade in back-to-back months after three months of strong recovery.

FTR’s Truck Loadings Index, which has a heavy concentration of industrial freight volumes, has declined year-over-year on par with the -7.3% decline in industrial production forecasted for the full year 2020. Looking forward, FTR has lowered their estimates for industrial production growth to just 3.9% in 2021 but still expect that to help drive increases in freight volumes to year-over-year inflationary levels by March and back to pre-pandemic levels by the end of next year.
Increased consumer spending on retail goods has resulted in retail inventory to sales ratios falling to an all time low. Inventory restocking, particularly in the retail sector, should continue to provide a boost to truckload demand well into 2021.
The chart below plots the total inbound ocean TEU volume on the lane from China to the U.S. (IOTI.CHNUSA) in blue, against the total outbound tender volume index for the U.S. (OTVI.USA) in green. The correlation between the volume of Chinese imports and corresponding domestic, over-the-road freight volumes is striking and supports the conclusion that as long as imports continue to flow in at the pace they are, total truckload demand should remain elevated. With retail inventories near an all-time low, we should expect to see inventory restocking drive strong freight volumes in the months ahead.
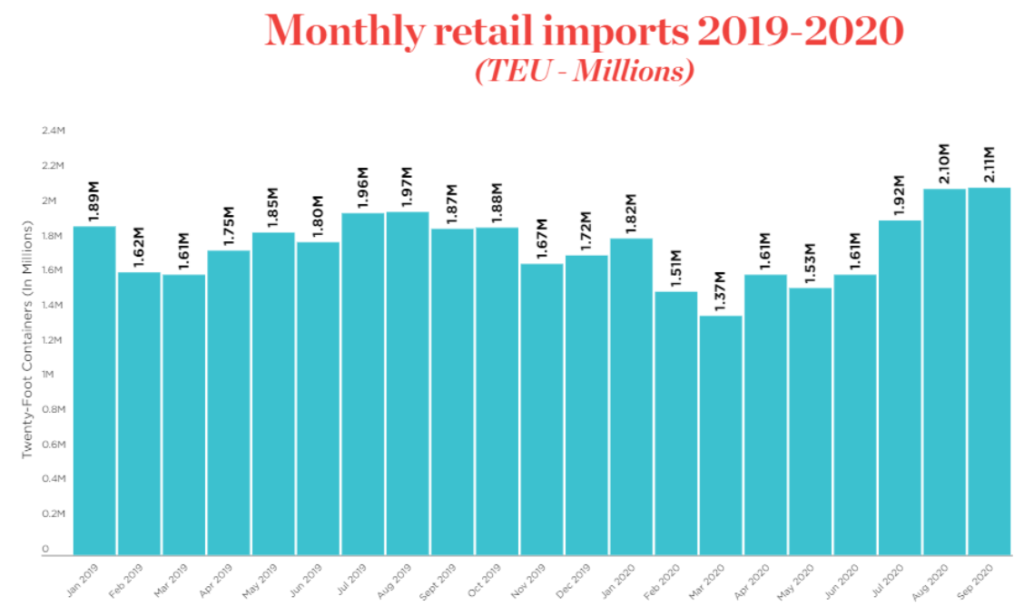
Retail import shipments peaked at all time record levels of 2.11 Million TEU’s in September 2020. With inventory levels as low as they are, above average import shipments are expected to continue.
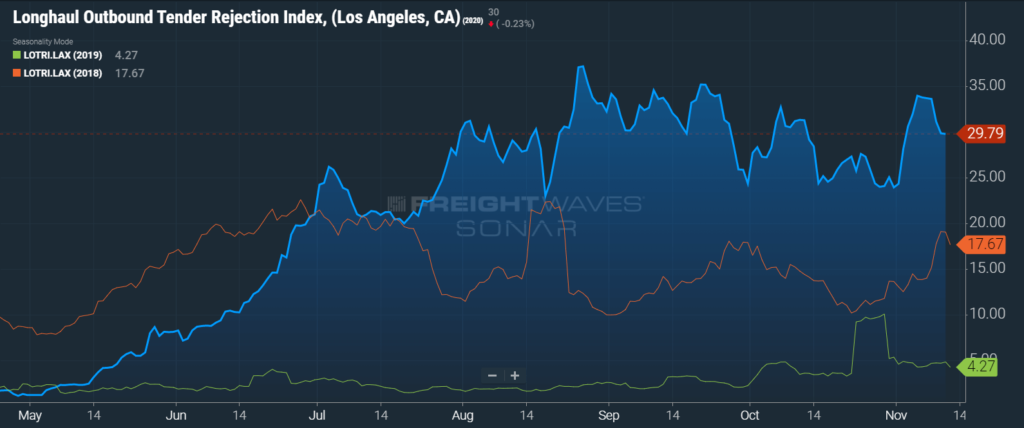
The sharp increase in tender rejections on longhaul freight outbound from southern California in early November provides evidence that the rise in imports is a major driver of the tightening market condition trends we have seen as of late. Depleted inventories across the country need to be replenished. We expect southern California to be even tighter and more expensive as we approach the peak retail shipping season later in Q4.
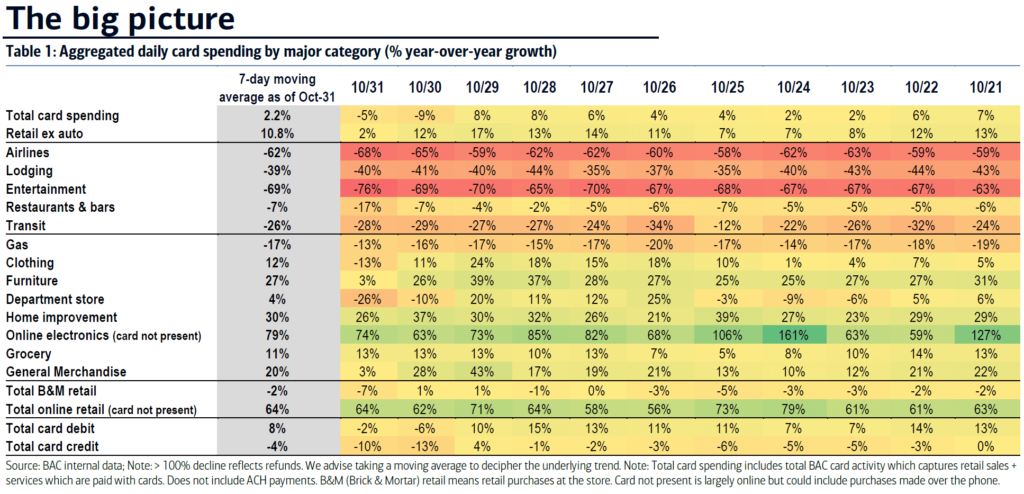
The Bank of America (BofA) consumer spending data provides visibility into changing consumer behaviors as a result of the pandemic. The main takeaways from this month’s data are consistent with what we have seen in recent months.
First, total card spending was up 2.2% year-over-year for the week ending October 31st.
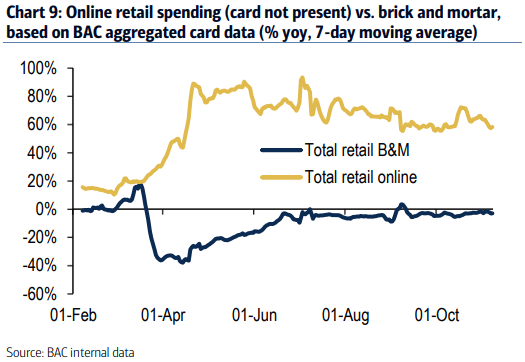
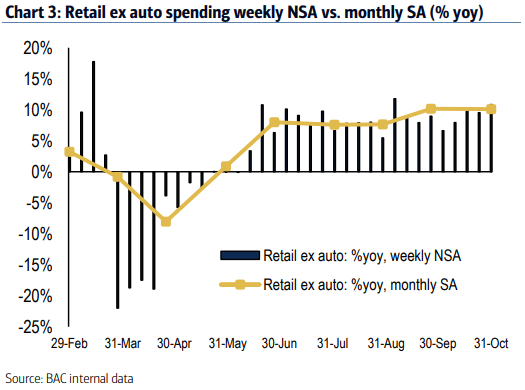
Second, the shift to e-commerce and online shopping continues to be a major trend seen in the retail sector. Growth in online retail spending has been consistently greater than 50% year-over-year, even though year-over-year declines in retail brick and mortar remain minimal. This has resulted in total retail sales, excluding autos, increasing by about 10% year-over-year.
Lastly, spending on durable goods continues to trend at elevated levels while spending on entertainment, travel and lodging and other related services or activities has remained low. People are traveling less and spending more on freight heavy things like furniture, electronics and home improvement, which helps explain the growth we have seen in spot freight volumes.

The unemployment trends continue to be concerning. Even though new initial claims and continued claims are improving week-over-week, this situation is still much worse than ever previously recorded. Initial claims continue to trend above 700,000, and continued claims are still greater than 6.7 million on a weekly basis.
We are right on the verge of what appears to be another wild ride through the holiday shipping season. Demand is expected to rise through the end of the year, and the growing driver shortage has left shippers with very few options. Shippers should expect to continue to see low tender acceptance rates drive increasing truck costs through at least the end of the year as carrier networks struggle to keep up. Capacity is scarce, but it is out there. The best course of action to ensure consistent coverage at below market costs is to take steps to limit the volatility of freight volumes in your network and provide carriers with ample lead time.
There continues to be a high level of unknowns as we think about 2021.
COVID cases are on the rise, but there is plenty of optimism surrounding a possible vaccine. There is uncertainty about what that means for the American economy and more specifically, the transportation markets. A case could be made for both inflationary or deflationary pressures if a vaccine enabled a more normal lifestyle for the American people. For now, rising case counts likely mean more headwinds for driver availability as driving school closures increase, limiting throughput.
The election has not brought us much clarity on what to expect for a stimulus or infrastructure package. Recent events indicate that there will not likely be anything passed until at least Q1. Bipartisan cooperation will be necessary to get any deal done, which could result in more delays, or a smaller overall package being passed. Ultimately, any stimulus would be beneficial to truckload demand by enabling a continuation of the consumer spending patterns we have seen since the pandemic introduced us to a new normal.
The ongoing issues with demand volatility and the questions surrounding driver availability indicate that the active spot market is here to stay. We may see rates fall slightly in Q1 as demand eases through the winter months and the slow period in Q1, but the capacity issues are not going away. When demand picks back up in spring/summer, we should expect to see these capacity issues become exposed yet again, leading to increasing spot rates. Shippers who place a high value on predictable transportation costs should consider moving to lock in the capacity that is available to them heading into the new year. This likely means year-over-year contract rate increases, but it is the best option to enable controllable costs through at least the first half of the year.


